

54%
OF HOMES SOLD ABOVE LIST PRICE
88%
OF HOMES SOLD WITHIN 30 DAYS OR LESS
1.1
MONTHS SUPPLY OF AVAILABLE HOMES*
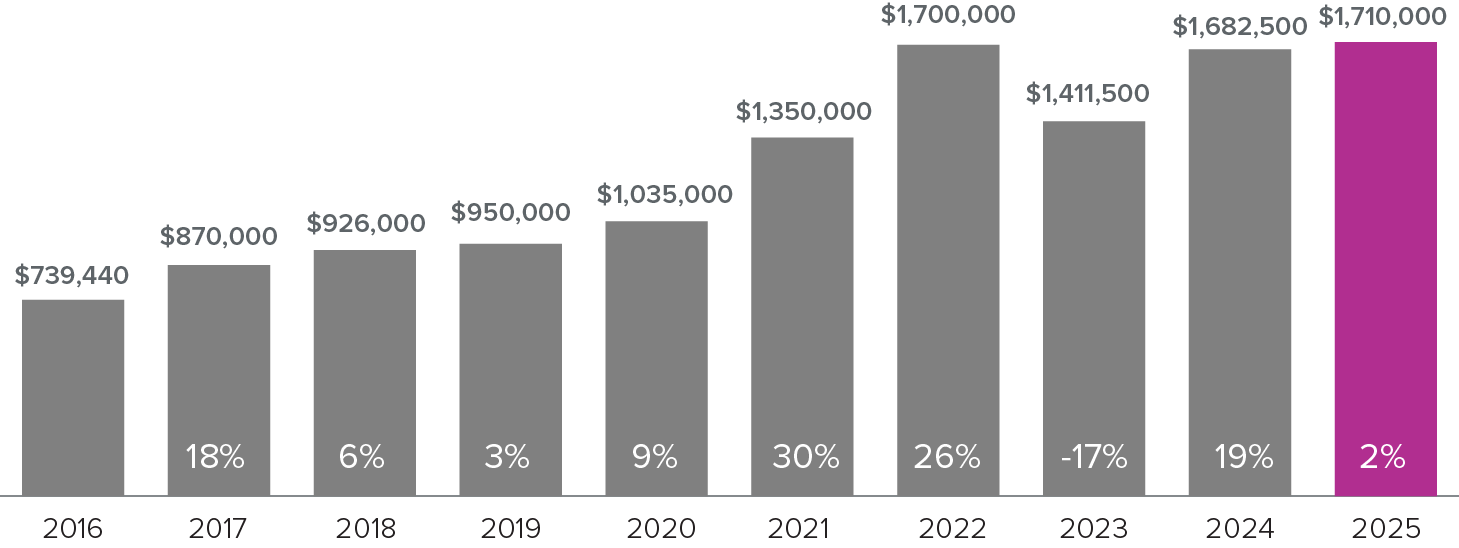
Median Closed Sales Price
*Months supply of available homes is calculated by dividing active inventory at the end of the month by pending. Pending sales are mutual purchase agreements that haven't closed yet.
**Graphs were created using data provided by Windermere Real Estate and NWMLS, but the information was not verified or published by NWMLS. Data reflects all new and resale single-family home sales, which include townhomes and exclude condos, for the month of March 2025.
The Spring market continues to be robust with the median price of a single family residence (SFR) increasing another $25k to $1.71 million on the Eastside and $35k in Seattle to $1 million. 79% of Eastside homes and 71% of Seattle homes sold within 15 days. The Eastside condo market had an increase in inventory and a 9.8% drop in the median price to $710,000. Mostly a correction to the 7% price increase we saw last month. Seattle’s condo market remained stable with a slight ($2650) increase in the median price to $627,650.
It’s too soon to tell what the impact of current economic and political uncertainty will have, but I do expect housing prices to stabilize over the next few months as inventory increases. Countering those factors, stock market volatility often leads to more investment in real estate as a safer haven. Also, interest rates are trending down, which tends to increase buyer activity.
43%
OF HOMES SOLD ABOVE LIST PRICE
83%
OF HOMES SOLD WITHIN 30 DAYS OR LESS
1.2
MONTHS SUPPLY OF AVAILABLE HOMES*
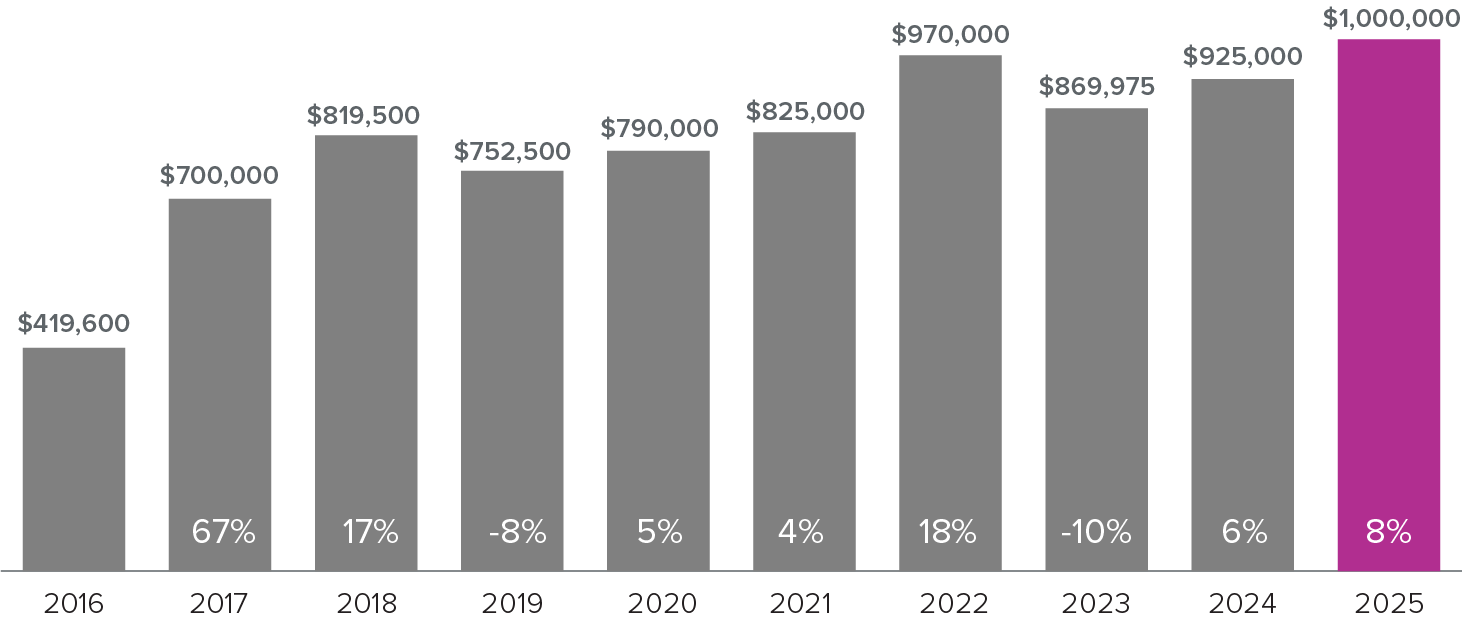
Median Closed Sales Price
*Months supply of available homes is calculated by dividing active inventory at the end of the month by pending. Pending sales are mutual purchase agreements that haven't closed yet.
**Graphs were created using data provided by Windermere Real Estate and NWMLS, but the information was not verified or published by NWMLS. Data reflects all new and resale single-family home sales, which include townhomes and exclude condos, for the month of March 2025.
The Spring market continues to be robust with the median price of a single family residence (SFR) increasing another $25k to $1.71 million on the Eastside and $35k in Seattle to $1 million. 79% of Eastside homes and 71% of Seattle homes sold within 15 days. The Eastside condo market had an increase in inventory and a 9.8% drop in the median price to $710,000. Mostly a correction to the 7% price increase we saw last month. Seattle’s condo market remained stable with a slight ($2650) increase in the median price to $627,650.
It’s too soon to tell what the impact of current economic and political uncertainty will have, but I do expect housing prices to stabilize over the next few months as inventory increases. Countering those factors, stock market volatility often leads to more investment in real estate as a safer haven. Also, interest rates are trending down, which tends to increase buyer activity.
32%
OF HOMES SOLD ABOVE LIST PRICE
74%
OF HOMES SOLD WITHIN 30 DAYS OR LESS
1.0
MONTHS SUPPLY OF AVAILABLE HOMES*
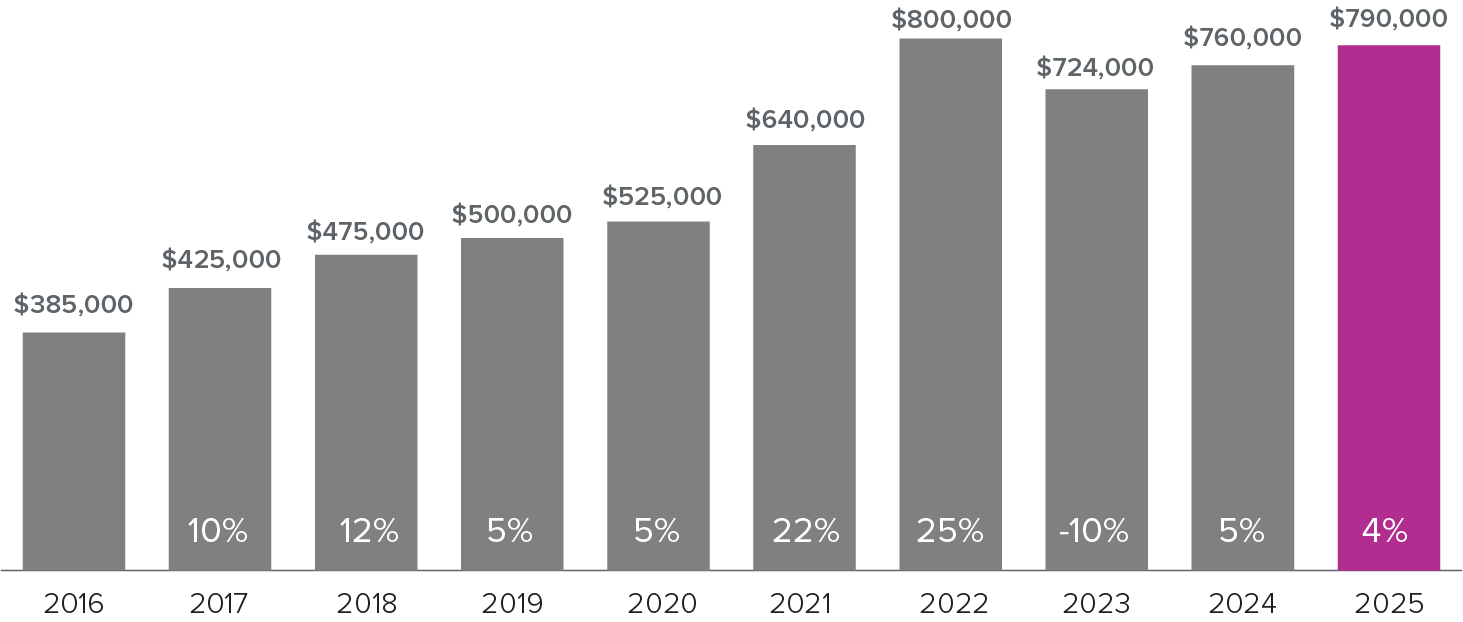
Median Closed Sales Price
*Months supply of available homes is calculated by dividing active inventory at the end of the month by pending. Pending sales are mutual purchase agreements that haven't closed yet.
**Graphs were created using data provided by Windermere Real Estate and NWMLS, but the information was not verified or published by NWMLS. Data reflects all new and resale single-family home sales, which include townhomes and exclude condos, for the month of March 2025.
The Spring market continues to be robust with the median price of a single family residence (SFR) increasing another $25k to $1.71 million on the Eastside and $35k in Seattle to $1 million. 79% of Eastside homes and 71% of Seattle homes sold within 15 days. The Eastside condo market had an increase in inventory and a 9.8% drop in the median price to $710,000. Mostly a correction to the 7% price increase we saw last month. Seattle’s condo market remained stable with a slight ($2650) increase in the median price to $627,650.
It’s too soon to tell what the impact of current economic and political uncertainty will have, but I do expect housing prices to stabilize over the next few months as inventory increases. Countering those factors, stock market volatility often leads to more investment in real estate as a safer haven. Also, interest rates are trending down, which tends to increase buyer activity.
54%
OF HOMES SOLD ABOVE LIST PRICE
88%
OF HOMES SOLD WITHIN 30 DAYS OR LESS
1.1
MONTHS SUPPLY OF AVAILABLE HOMES*
Median Closed Sales Price

*Months supply of available homes is calculated by dividing active inventory at the end of the month by pending. Pending sales are mutual purchase agreements that haven't closed yet.
**Graphs were created using data provided by Windermere Real Estate and NWMLS, but the information was not verified or published by NWMLS. Data reflects all new and resale single-family home sales, which include townhomes and exclude condos, for the month of March 2025.
The Spring market continues to be robust with the median price of a single family residence (SFR) increasing another $25k to $1.71 million on the Eastside and $35k in Seattle to $1 million. 79% of Eastside homes and 71% of Seattle homes sold within 15 days. The Eastside condo market had an increase in inventory and a 9.8% drop in the median price to $710,000. Mostly a correction to the 7% price increase we saw last month. Seattle’s condo market remained stable with a slight ($2650) increase in the median price to $627,650.
It’s too soon to tell what the impact of current economic and political uncertainty will have, but I do expect housing prices to stabilize over the next few months as inventory increases. Countering those factors, stock market volatility often leads to more investment in real estate as a safer haven. Also, interest rates are trending down, which tends to increase buyer activity.
43%
OF HOMES SOLD ABOVE LIST PRICE
83%
OF HOMES SOLD WITHIN 30 DAYS OR LESS
1.2
MONTHS SUPPLY OF AVAILABLE HOMES*
Median Closed Sales Price

*Months supply of available homes is calculated by dividing active inventory at the end of the month by pending. Pending sales are mutual purchase agreements that haven't closed yet.
**Graphs were created using data provided by Windermere Real Estate and NWMLS, but the information was not verified or published by NWMLS. Data reflects all new and resale single-family home sales, which include townhomes and exclude condos, for the month of March 2025.
The Spring market continues to be robust with the median price of a single family residence (SFR) increasing another $25k to $1.71 million on the Eastside and $35k in Seattle to $1 million. 79% of Eastside homes and 71% of Seattle homes sold within 15 days. The Eastside condo market had an increase in inventory and a 9.8% drop in the median price to $710,000. Mostly a correction to the 7% price increase we saw last month. Seattle’s condo market remained stable with a slight ($2650) increase in the median price to $627,650.
It’s too soon to tell what the impact of current economic and political uncertainty will have, but I do expect housing prices to stabilize over the next few months as inventory increases. Countering those factors, stock market volatility often leads to more investment in real estate as a safer haven. Also, interest rates are trending down, which tends to increase buyer activity.
32%
OF HOMES SOLD ABOVE LIST PRICE
74%
OF HOMES SOLD WITHIN 30 DAYS OR LESS
1.0
MONTHS SUPPLY OF AVAILABLE HOMES*
Median Closed Sales Price

*Months supply of available homes is calculated by dividing active inventory at the end of the month by pending. Pending sales are mutual purchase agreements that haven't closed yet.
**Graphs were created using data provided by Windermere Real Estate and NWMLS, but the information was not verified or published by NWMLS. Data reflects all new and resale single-family home sales, which include townhomes and exclude condos, for the month of March 2025.
The Spring market continues to be robust with the median price of a single family residence (SFR) increasing another $25k to $1.71 million on the Eastside and $35k in Seattle to $1 million. 79% of Eastside homes and 71% of Seattle homes sold within 15 days. The Eastside condo market had an increase in inventory and a 9.8% drop in the median price to $710,000. Mostly a correction to the 7% price increase we saw last month. Seattle’s condo market remained stable with a slight ($2650) increase in the median price to $627,650.
It’s too soon to tell what the impact of current economic and political uncertainty will have, but I do expect housing prices to stabilize over the next few months as inventory increases. Countering those factors, stock market volatility often leads to more investment in real estate as a safer haven. Also, interest rates are trending down, which tends to increase buyer activity.
52%
OF HOMES SOLD ABOVE LIST PRICE
77%
OF HOMES SOLD WITHIN 30 DAYS OR LESS
1.5
MONTHS SUPPLY OF AVAILABLE HOMES*
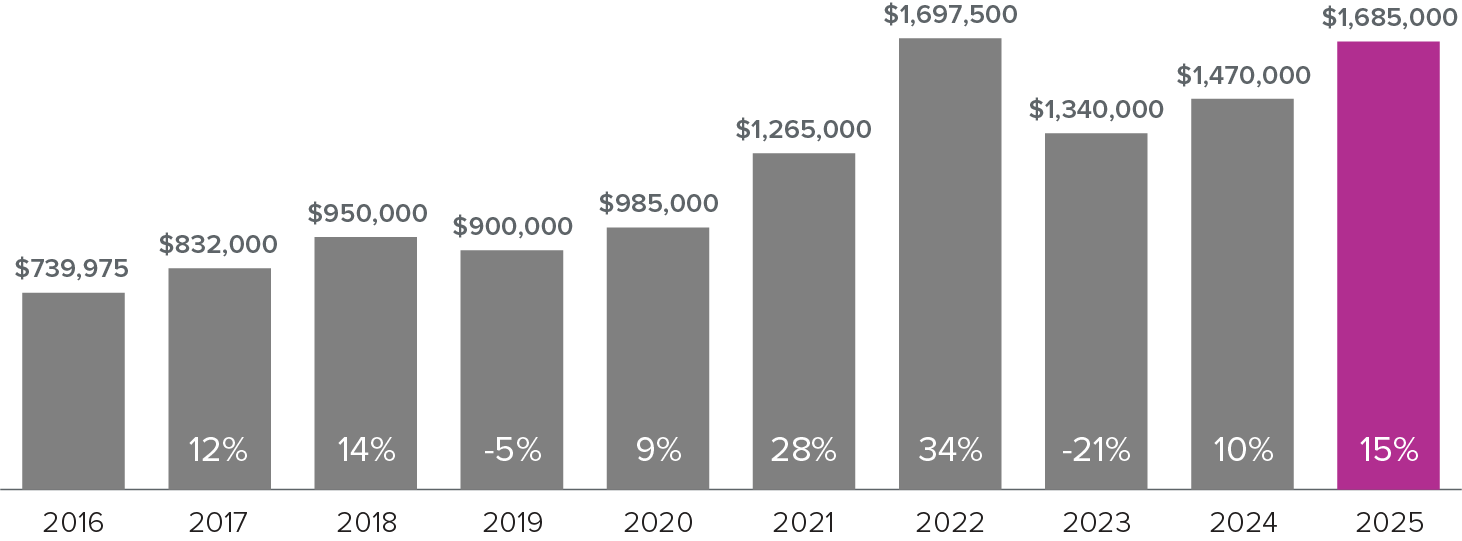
Median Closed Sales Price
*Months supply of available homes is calculated by dividing active inventory at the end of the month by pending. Pending sales are mutual purchase agreements that haven't closed yet.
**Graphs were created using data provided by Windermere Real Estate and NWMLS, but the information was not verified or published by NWMLS. Data reflects all new and resale single-family home sales, which include townhomes and exclude condos, for the month of February 2025.
Our Spring market has officially arrived! Activity has been hot on both the Eastside and in Seattle. A case in point is my February Kirkland listing which had multiple offers and sold above list price in just 4 days for $3,680,000. While there was a small ($24,000) decrease in the median price of a Single Family Residence (SFR) on the Eastside in February to $1,685,000, over half of closed homes sold above list price and over 70% sold in less than 15 days. Higher prices are pushing more buyers into the condo market where we saw another 7% increase in the median price to $787,475, an all-time high.
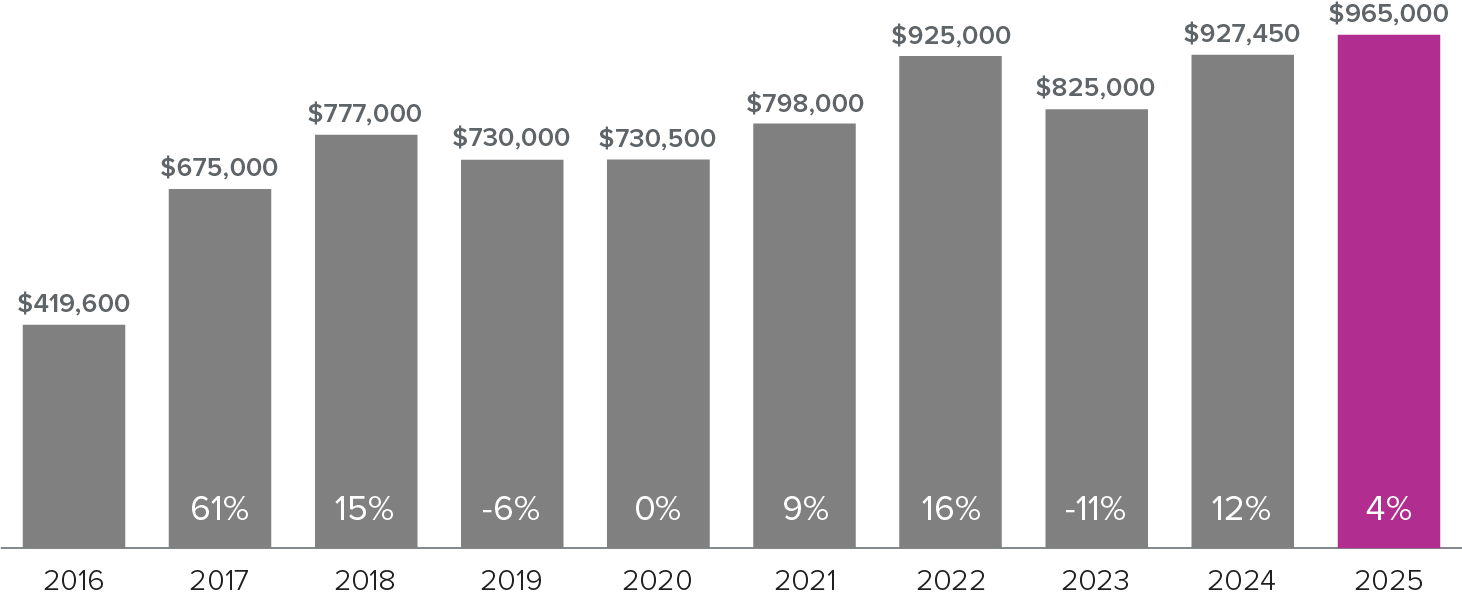
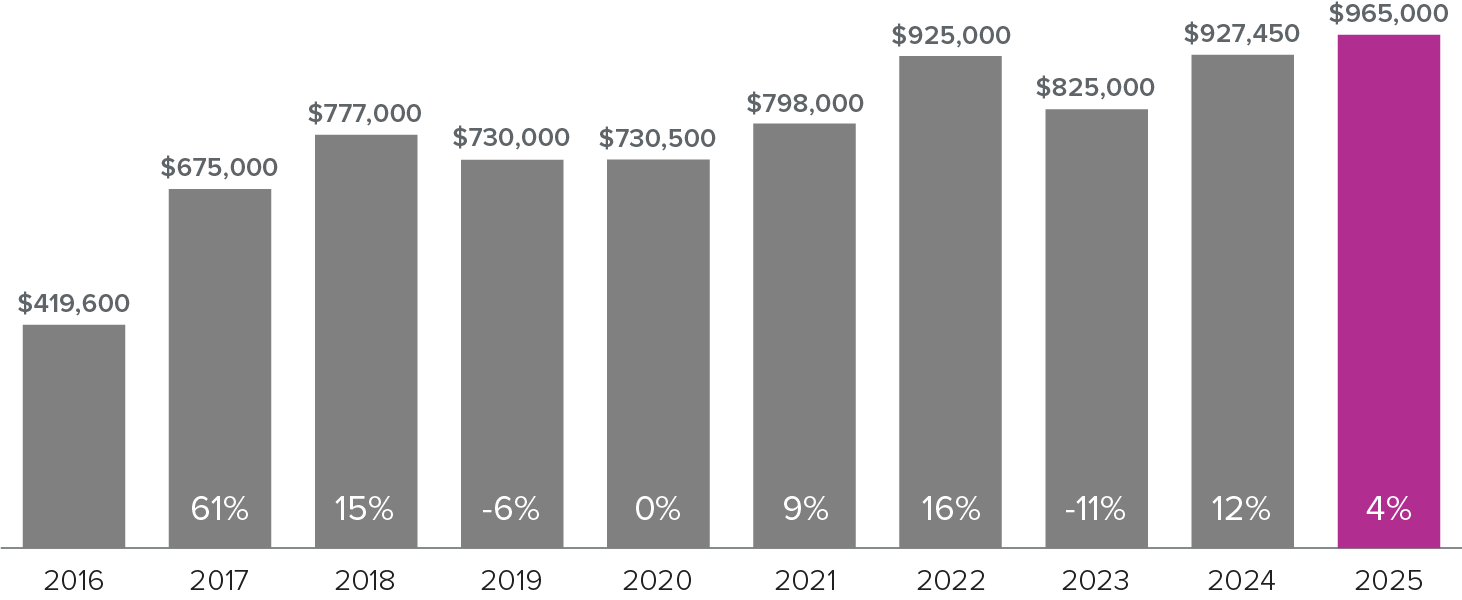
Seattle market activity also picked up significantly. The median price of a SFR increased over $107,000 (12.5%) to $965,000. 42% sold above list price and 70% sold within 15 days – almost double the activity of the previous month. Interest rates dipping a bit certainly are helping fuel activity as is Seattle’s return-to-work requirements. As I mentioned in my last newsletter, the median price of a Seattle condo shot up a shocking 25% in January. It wasn’t surprising, then, to see it come down 9.4% in February to $625,000.
42%
OF HOMES SOLD ABOVE LIST PRICE
77%
OF HOMES SOLD WITHIN 30 DAYS OR LESS
1.4
MONTHS SUPPLY OF AVAILABLE HOMES*
Median Closed Sales Price
*Months supply of available homes is calculated by dividing active inventory at the end of the month by pending. Pending sales are mutual purchase agreements that haven't closed yet.
**Graphs were created using data provided by Windermere Real Estate and NWMLS, but the information was not verified or published by NWMLS. Data reflects all new and resale single-family home sales, which include townhomes and exclude condos, for the month of February 2025.
Our Spring market has officially arrived! Activity has been hot on both the Eastside and in Seattle. A case in point is my February Kirkland listing which had multiple offers and sold above list price in just 4 days for $3,680,000. While there was a small ($24,000) decrease in the median price of a Single Family Residence (SFR) on the Eastside in February to $1,685,000, over half of closed homes sold above list price and over 70% sold in less than 15 days. Higher prices are pushing more buyers into the condo market where we saw another 7% increase in the median price to $787,475, an all-time high.
Seattle market activity also picked up significantly. The median price of a SFR increased over $107,000 (12.5%) to $965,000. 42% sold above list price and 70% sold within 15 days – almost double the activity of the previous month. Interest rates dipping a bit certainly are helping fuel activity as is Seattle’s return-to-work requirements. As I mentioned in my last newsletter, the median price of a Seattle condo shot up a shocking 25% in January. It wasn’t surprising, then, to see it come down 9.4% in February to $625,000.
29%
OF HOMES SOLD ABOVE LIST PRICE
69%
OF HOMES SOLD WITHIN 30 DAYS OR LESS
1.2
MONTHS SUPPLY OF AVAILABLE HOMES*
Median Closed Sales Price
*Months supply of available homes is calculated by dividing active inventory at the end of the month by pending. Pending sales are mutual purchase agreements that haven't closed yet.
**Graphs were created using data provided by Windermere Real Estate and NWMLS, but the information was not verified or published by NWMLS. Data reflects all new and resale single-family home sales, which include townhomes and exclude condos, for the month of February 2025.
Our Spring market has officially arrived! Activity has been hot on both the Eastside and in Seattle. A case in point is my February Kirkland listing which had multiple offers and sold above list price in just 4 days for $3,680,000. While there was a small ($24,000) decrease in the median price of a Single Family Residence (SFR) on the Eastside in February to $1,685,000, over half of closed homes sold above list price and over 70% sold in less than 15 days. Higher prices are pushing more buyers into the condo market where we saw another 7% increase in the median price to $787,475, an all-time high.
Seattle market activity also picked up significantly. The median price of a SFR increased over $107,000 (12.5%) to $965,000. 42% sold above list price and 70% sold within 15 days – almost double the activity of the previous month. Interest rates dipping a bit certainly are helping fuel activity as is Seattle’s return-to-work requirements. As I mentioned in my last newsletter, the median price of a Seattle condo shot up a shocking 25% in January. It wasn’t surprising, then, to see it come down 9.4% in February to $625,000.
52%
OF HOMES SOLD ABOVE LIST PRICE
77%
OF HOMES SOLD WITHIN 30 DAYS OR LESS
1.5
MONTHS SUPPLY OF AVAILABLE HOMES*
Median Closed Sales Price

*Months supply of available homes is calculated by dividing active inventory at the end of the month by pending. Pending sales are mutual purchase agreements that haven't closed yet.
**Graphs were created using data provided by Windermere Real Estate and NWMLS, but the information was not verified or published by NWMLS. Data reflects all new and resale single-family home sales, which include townhomes and exclude condos, for the month of February 2025.
Our Spring market has officially arrived! Activity has been hot on both the Eastside and in Seattle. A case in point is my February Kirkland listing which had multiple offers and sold above list price in just 4 days for $3,680,000. While there was a small ($24,000) decrease in the median price of a Single Family Residence (SFR) on the Eastside in February to $1,685,000, over half of closed homes sold above list price and over 70% sold in less than 15 days. Higher prices are pushing more buyers into the condo market where we saw another 7% increase in the median price to $787,475, an all-time high.
Seattle market activity also picked up significantly. The median price of a SFR increased over $107,000 (12.5%) to $965,000. 42% sold above list price and 70% sold within 15 days – almost double the activity of the previous month. Interest rates dipping a bit certainly are helping fuel activity as is Seattle’s return-to-work requirements. As I mentioned in my last newsletter, the median price of a Seattle condo shot up a shocking 25% in January. It wasn’t surprising, then, to see it come down 9.4% in February to $625,000.
42%
OF HOMES SOLD ABOVE LIST PRICE
77%
OF HOMES SOLD WITHIN 30 DAYS OR LESS
1.4
MONTHS SUPPLY OF AVAILABLE HOMES*
Median Closed Sales Price

*Months supply of available homes is calculated by dividing active inventory at the end of the month by pending. Pending sales are mutual purchase agreements that haven't closed yet.
**Graphs were created using data provided by Windermere Real Estate and NWMLS, but the information was not verified or published by NWMLS. Data reflects all new and resale single-family home sales, which include townhomes and exclude condos, for the month of February 2025.
Our Spring market has officially arrived! Activity has been hot on both the Eastside and in Seattle. A case in point is my February Kirkland listing which had multiple offers and sold above list price in just 4 days for $3,680,000. While there was a small ($24,000) decrease in the median price of a Single Family Residence (SFR) on the Eastside in February to $1,685,000, over half of closed homes sold above list price and over 70% sold in less than 15 days. Higher prices are pushing more buyers into the condo market where we saw another 7% increase in the median price to $787,475, an all-time high.
Seattle market activity also picked up significantly. The median price of a SFR increased over $107,000 (12.5%) to $965,000. 42% sold above list price and 70% sold within 15 days – almost double the activity of the previous month. Interest rates dipping a bit certainly are helping fuel activity as is Seattle’s return-to-work requirements. As I mentioned in my last newsletter, the median price of a Seattle condo shot up a shocking 25% in January. It wasn’t surprising, then, to see it come down 9.4% in February to $625,000.
29%
OF HOMES SOLD ABOVE LIST PRICE
69%
OF HOMES SOLD WITHIN 30 DAYS OR LESS
1.2
MONTHS SUPPLY OF AVAILABLE HOMES*
Median Closed Sales Price

*Months supply of available homes is calculated by dividing active inventory at the end of the month by pending. Pending sales are mutual purchase agreements that haven't closed yet.
**Graphs were created using data provided by Windermere Real Estate and NWMLS, but the information was not verified or published by NWMLS. Data reflects all new and resale single-family home sales, which include townhomes and exclude condos, for the month of February 2025.
Our Spring market has officially arrived! Activity has been hot on both the Eastside and in Seattle. A case in point is my February Kirkland listing which had multiple offers and sold above list price in just 4 days for $3,680,000. While there was a small ($24,000) decrease in the median price of a Single Family Residence (SFR) on the Eastside in February to $1,685,000, over half of closed homes sold above list price and over 70% sold in less than 15 days. Higher prices are pushing more buyers into the condo market where we saw another 7% increase in the median price to $787,475, an all-time high.
Seattle market activity also picked up significantly. The median price of a SFR increased over $107,000 (12.5%) to $965,000. 42% sold above list price and 70% sold within 15 days – almost double the activity of the previous month. Interest rates dipping a bit certainly are helping fuel activity as is Seattle’s return-to-work requirements. As I mentioned in my last newsletter, the median price of a Seattle condo shot up a shocking 25% in January. It wasn’t surprising, then, to see it come down 9.4% in February to $625,000.
31%
OF HOMES SOLD ABOVE LIST PRICE
66%
OF HOMES SOLD WITHIN 30 DAYS OR LESS
1.5
MONTHS SUPPLY OF AVAILABLE HOMES*
Median Closed Sales Price

*Months supply of available homes is calculated by dividing active inventory at the end of the month by pending. Pending sales are mutual purchase agreements that haven't closed yet.
**Graphs were created using data provided by Windermere Real Estate and NWMLS, but the information was not verified or published by NWMLS. Data reflects all new and resale single-family home sales, which include townhomes and exclude condos, for the month of January 2025.
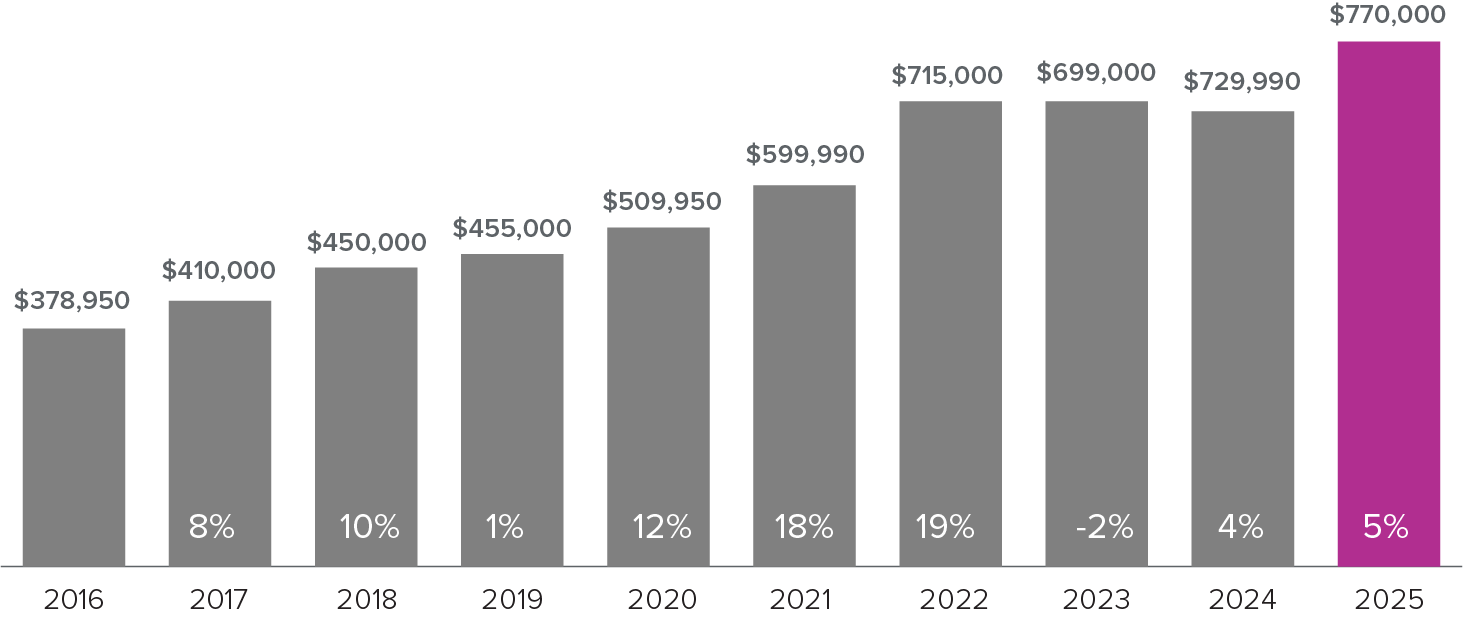
January unfolded a little differently than expected. Buyer interest was definitely up as evidenced by increased attendance at open houses and multiple offers on hot properties. However, inventory did not increase as much as anticipated. On the Eastside, the result was a whopping 10.6% increase in the median price of a Single Family Residence to just over $1.7 million. That is the highest figure -ever- for January. The median price of an Eastside condo increased over 5% to $734,900. I expect inventory to increase significantly in February, which should have a tempering effect on pricing. Seattle’s SFR market appears to be lagging the Eastside (which is often the case). Their median price decreased 4.6% to $857,500. The big outlier was the Seattle condo market where inventory decreased significantly (from 3.5 months to 2.8 months) and the median price leapt 25% to $689,975! Perhaps due to the new “Return to Work” requirement? Time will tell.
It's been interesting to experience the difference between our local real estate market and Coachella Valley’s. The market there is much slower-paced, allowing those interested in escaping our cold weather to experience a more relaxed buying experience with less competition and lower prices.
22%
OF HOMES SOLD ABOVE LIST PRICE
49%
OF HOMES SOLD WITHIN 30 DAYS OR LESS
1.5
MONTHS SUPPLY OF AVAILABLE HOMES*
Median Closed Sales Price

*Months supply of available homes is calculated by dividing active inventory at the end of the month by pending. Pending sales are mutual purchase agreements that haven't closed yet.
**Graphs were created using data provided by Windermere Real Estate and NWMLS, but the information was not verified or published by NWMLS. Data reflects all new and resale single-family home sales, which include townhomes and exclude condos, for the month of January 2025.
January unfolded a little differently than expected. Buyer interest was definitely up as evidenced by increased attendance at open houses and multiple offers on hot properties. However, inventory did not increase as much as anticipated. On the Eastside, the result was a whopping 10.6% increase in the median price of a Single Family Residence to just over $1.7 million. That is the highest figure -ever- for January. The median price of an Eastside condo increased over 5% to $734,900. I expect inventory to increase significantly in February, which should have a tempering effect on pricing. Seattle’s SFR market appears to be lagging the Eastside (which is often the case). Their median price decreased 4.6% to $857,500. The big outlier was the Seattle condo market where inventory decreased significantly (from 3.5 months to 2.8 months) and the median price leapt 25% to $689,975! Perhaps due to the new “Return to Work” requirement? Time will tell.
It's been interesting to experience the difference between our local real estate market and Coachella Valley’s. The market there is much slower-paced, allowing those interested in escaping our cold weather to experience a more relaxed buying experience with less competition and lower prices.
21%
OF HOMES SOLD ABOVE LIST PRICE
57%
OF HOMES SOLD WITHIN 30 DAYS OR LESS
1.0
MONTHS SUPPLY OF AVAILABLE HOMES*
Median Closed Sales Price
*Months supply of available homes is calculated by dividing active inventory at the end of the month by pending. Pending sales are mutual purchase agreements that haven't closed yet.
**Graphs were created using data provided by Windermere Real Estate and NWMLS, but the information was not verified or published by NWMLS. Data reflects all new and resale single-family home sales, which include townhomes and exclude condos, for the month of January 2025.
January unfolded a little differently than expected. Buyer interest was definitely up as evidenced by increased attendance at open houses and multiple offers on hot properties. However, inventory did not increase as much as anticipated. On the Eastside, the result was a whopping 10.6% increase in the median price of a Single Family Residence to just over $1.7 million. That is the highest figure -ever- for January. The median price of an Eastside condo increased over 5% to $734,900. I expect inventory to increase significantly in February, which should have a tempering effect on pricing. Seattle’s SFR market appears to be lagging the Eastside (which is often the case). Their median price decreased 4.6% to $857,500. The big outlier was the Seattle condo market where inventory decreased significantly (from 3.5 months to 2.8 months) and the median price leapt 25% to $689,975! Perhaps due to the new “Return to Work” requirement? Time will tell.
It's been interesting to experience the difference between our local real estate market and Coachella Valley’s. The market there is much slower-paced, allowing those interested in escaping our cold weather to experience a more relaxed buying experience with less competition and lower prices.
31%
OF HOMES SOLD ABOVE LIST PRICE
66%
OF HOMES SOLD WITHIN 30 DAYS OR LESS
1.5
MONTHS SUPPLY OF AVAILABLE HOMES*
Median Closed Sales Price

*Months supply of available homes is calculated by dividing active inventory at the end of the month by pending. Pending sales are mutual purchase agreements that haven't closed yet.
**Graphs were created using data provided by Windermere Real Estate and NWMLS, but the information was not verified or published by NWMLS. Data reflects all new and resale single-family home sales, which include townhomes and exclude condos, for the month of January 2025.
January unfolded a little differently than expected. Buyer interest was definitely up as evidenced by increased attendance at open houses and multiple offers on hot properties. However, inventory did not increase as much as anticipated. On the Eastside, the result was a whopping 10.6% increase in the median price of a Single Family Residence to just over $1.7 million. That is the highest figure -ever- for January. The median price of an Eastside condo increased over 5% to $734,900. I expect inventory to increase significantly in February, which should have a tempering effect on pricing. Seattle’s SFR market appears to be lagging the Eastside (which is often the case). Their median price decreased 4.6% to $857,500. The big outlier was the Seattle condo market where inventory decreased significantly (from 3.5 months to 2.8 months) and the median price leapt 25% to $689,975! Perhaps due to the new “Return to Work” requirement? Time will tell.
It's been interesting to experience the difference between our local real estate market and Coachella Valley’s. The market there is much slower-paced, allowing those interested in escaping our cold weather to experience a more relaxed buying experience with less competition and lower prices.
22%
OF HOMES SOLD ABOVE LIST PRICE
49%
OF HOMES SOLD WITHIN 30 DAYS OR LESS
1.5
MONTHS SUPPLY OF AVAILABLE HOMES*
Median Closed Sales Price

*Months supply of available homes is calculated by dividing active inventory at the end of the month by pending. Pending sales are mutual purchase agreements that haven't closed yet.
**Graphs were created using data provided by Windermere Real Estate and NWMLS, but the information was not verified or published by NWMLS. Data reflects all new and resale single-family home sales, which include townhomes and exclude condos, for the month of January 2025.
January unfolded a little differently than expected. Buyer interest was definitely up as evidenced by increased attendance at open houses and multiple offers on hot properties. However, inventory did not increase as much as anticipated. On the Eastside, the result was a whopping 10.6% increase in the median price of a Single Family Residence to just over $1.7 million. That is the highest figure -ever- for January. The median price of an Eastside condo increased over 5% to $734,900. I expect inventory to increase significantly in February, which should have a tempering effect on pricing. Seattle’s SFR market appears to be lagging the Eastside (which is often the case). Their median price decreased 4.6% to $857,500. The big outlier was the Seattle condo market where inventory decreased significantly (from 3.5 months to 2.8 months) and the median price leapt 25% to $689,975! Perhaps due to the new “Return to Work” requirement? Time will tell.
It's been interesting to experience the difference between our local real estate market and Coachella Valley’s. The market there is much slower-paced, allowing those interested in escaping our cold weather to experience a more relaxed buying experience with less competition and lower prices.
21%
OF HOMES SOLD ABOVE LIST PRICE
57%
OF HOMES SOLD WITHIN 30 DAYS OR LESS
1.0
MONTHS SUPPLY OF AVAILABLE HOMES*
Median Closed Sales Price

*Months supply of available homes is calculated by dividing active inventory at the end of the month by pending. Pending sales are mutual purchase agreements that haven't closed yet.
**Graphs were created using data provided by Windermere Real Estate and NWMLS, but the information was not verified or published by NWMLS. Data reflects all new and resale single-family home sales, which include townhomes and exclude condos, for the month of January 2025.
January unfolded a little differently than expected. Buyer interest was definitely up as evidenced by increased attendance at open houses and multiple offers on hot properties. However, inventory did not increase as much as anticipated. On the Eastside, the result was a whopping 10.6% increase in the median price of a Single Family Residence to just over $1.7 million. That is the highest figure -ever- for January. The median price of an Eastside condo increased over 5% to $734,900. I expect inventory to increase significantly in February, which should have a tempering effect on pricing. Seattle’s SFR market appears to be lagging the Eastside (which is often the case). Their median price decreased 4.6% to $857,500. The big outlier was the Seattle condo market where inventory decreased significantly (from 3.5 months to 2.8 months) and the median price leapt 25% to $689,975! Perhaps due to the new “Return to Work” requirement? Time will tell.
It's been interesting to experience the difference between our local real estate market and Coachella Valley’s. The market there is much slower-paced, allowing those interested in escaping our cold weather to experience a more relaxed buying experience with less competition and lower prices.
29%
OF HOMES SOLD ABOVE LIST PRICE
65%
OF HOMES SOLD WITHIN 30 DAYS OR LESS
1.6
MONTHS SUPPLY OF AVAILABLE HOMES*
Median Closed Sales Price
*Months supply of available homes is calculated by dividing active inventory at the end of the month by pending. Pending sales are mutual purchase agreements that haven't closed yet.
**Graphs were created using data provided by Windermere Real Estate and NWMLS, but the information was not verified or published by NWMLS. Data reflects all new and resale single-family home sales, which include townhomes and exclude condos, for the month of December 2024.
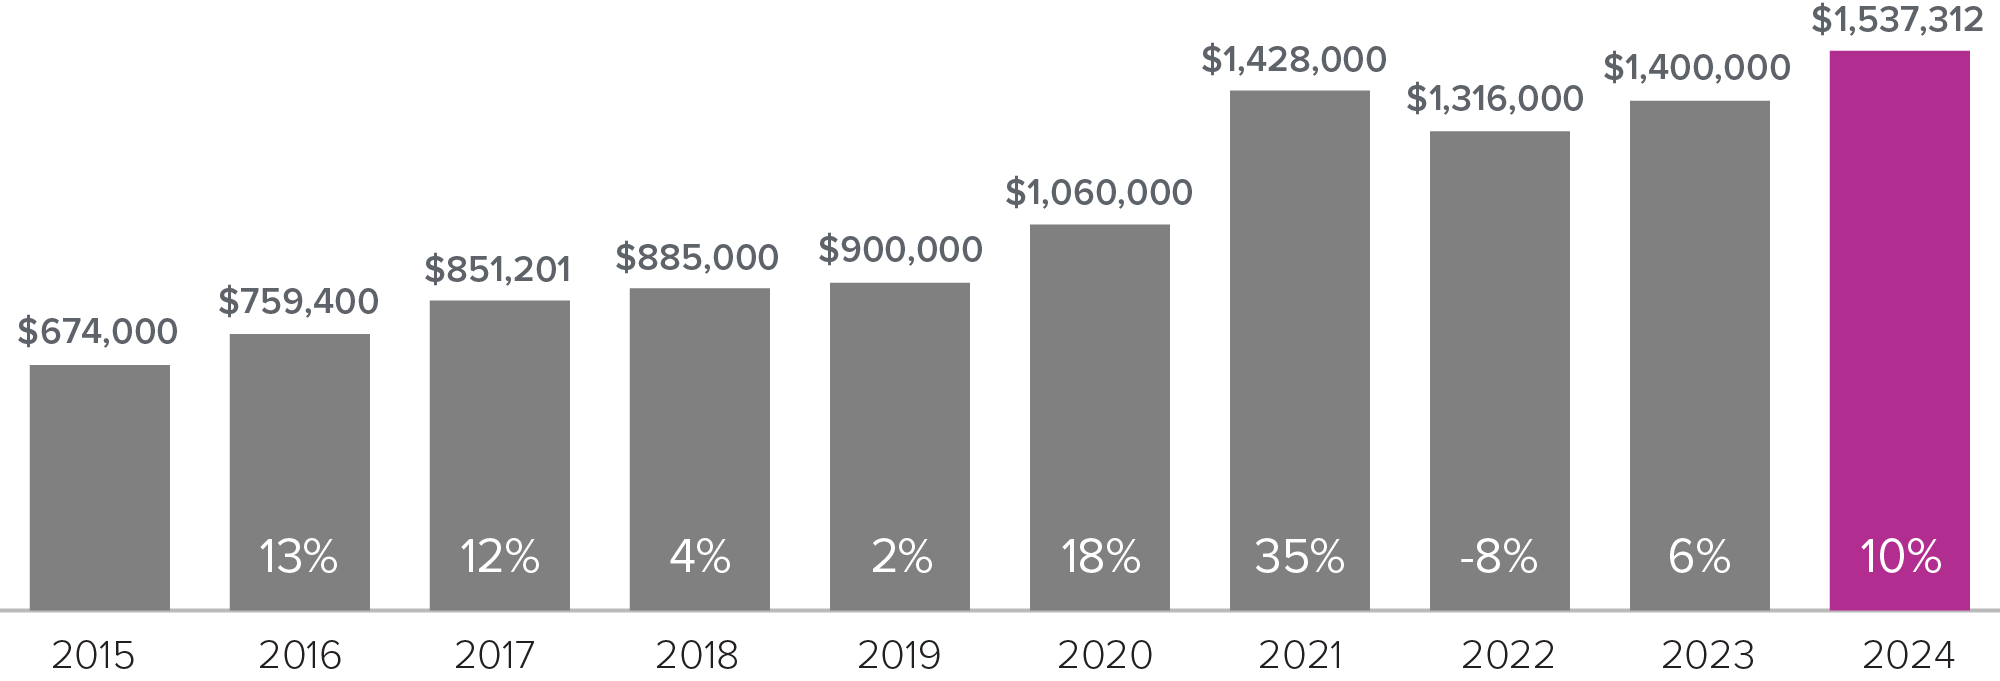
December stats didn’t hold any surprises – market times increased as they typically do at this time. Eastside inventory decreased, but so did buyer activity so there wasn’t a significant change to pricing. Seattle was a little more impacted, with a decrease to the median price of both single family homes and condos. Interest rates did tick up a little last month, but I think the holidays were the primary reason for our mini-slowdown and I expect activity to pick up significantly in the first quarter.
Whether you are considering selling your home or just want to keep it in top shape – almost every inspection report I see mentions the need to trim any vegetation around homes. Overhanging trees provide a highway for all sorts of vermin to invade attic spaces, causing potentially costly repairs. Now is a good time to trim back shrubs and limbs or hire a professional to do so. Another common item is disconnected ductwork in attics. Duct tape tends to degrade over time and this can lead to voids or separation. When warm, moist bathroom air accumulates in the attic rather than venting outside, the inevitable result is mold in the attic. It’s not uncommon to find no ductwork to the exterior, particularly in older homes. Fans should always vent to the outside, so if that is the case in your home, you’ll want to get the situation remedied as soon as possible. I have trusted professionals I can refer you to for both landscaping remediation and attic inspections/repairs.
17%
OF HOMES SOLD ABOVE LIST PRICE
57%
OF HOMES SOLD WITHIN 30 DAYS OR LESS
1.8
MONTHS SUPPLY OF AVAILABLE HOMES*
Median Closed Sales Price
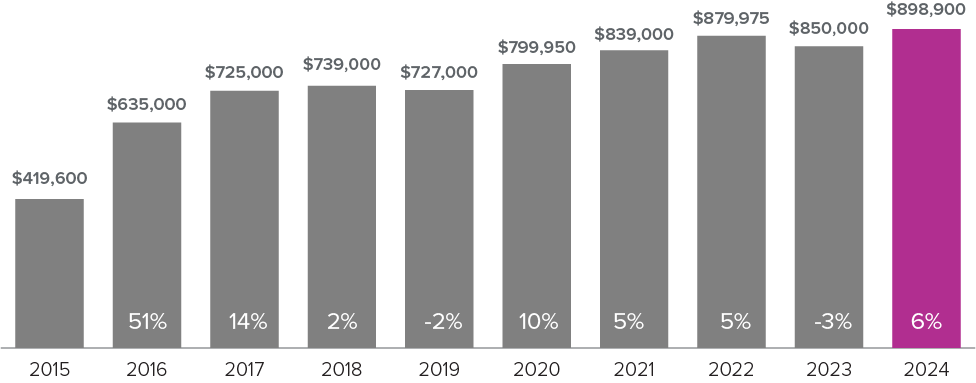
*Months supply of available homes is calculated by dividing active inventory at the end of the month by pending. Pending sales are mutual purchase agreements that haven't closed yet.
**Graphs were created using data provided by Windermere Real Estate and NWMLS, but the information was not verified or published by NWMLS. Data reflects all new and resale single-family home sales, which include townhomes and exclude condos, for the month of December 2024.
December stats didn’t hold any surprises – market times increased as they typically do at this time. Eastside inventory decreased, but so did buyer activity so there wasn’t a significant change to pricing. Seattle was a little more impacted, with a decrease to the median price of both single family homes and condos. Interest rates did tick up a little last month, but I think the holidays were the primary reason for our mini-slowdown and I expect activity to pick up significantly in the first quarter.
Whether you are considering selling your home or just want to keep it in top shape – almost every inspection report I see mentions the need to trim any vegetation around homes. Overhanging trees provide a highway for all sorts of vermin to invade attic spaces, causing potentially costly repairs. Now is a good time to trim back shrubs and limbs or hire a professional to do so. Another common item is disconnected ductwork in attics. Duct tape tends to degrade over time and this can lead to voids or separation. When warm, moist bathroom air accumulates in the attic rather than venting outside, the inevitable result is mold in the attic. It’s not uncommon to find no ductwork to the exterior, particularly in older homes. Fans should always vent to the outside, so if that is the case in your home, you’ll want to get the situation remedied as soon as possible. I have trusted professionals I can refer you to for both landscaping remediation and attic inspections/repairs.
22%
OF HOMES SOLD ABOVE LIST PRICE
61%
OF HOMES SOLD WITHIN 30 DAYS OR LESS
1.2
MONTHS SUPPLY OF AVAILABLE HOMES*
Median Closed Sales Price
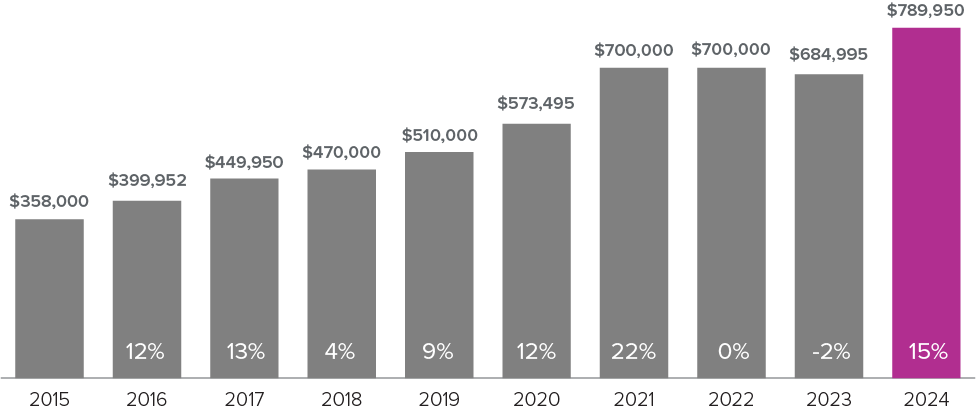
*Months supply of available homes is calculated by dividing active inventory at the end of the month by pending. Pending sales are mutual purchase agreements that haven't closed yet.
**Graphs were created using data provided by Windermere Real Estate and NWMLS, but the information was not verified or published by NWMLS. Data reflects all new and resale single-family home sales, which include townhomes and exclude condos, for the month of December 2024.
December stats didn’t hold any surprises – market times increased as they typically do at this time. Eastside inventory decreased, but so did buyer activity so there wasn’t a significant change to pricing. Seattle was a little more impacted, with a decrease to the median price of both single family homes and condos. Interest rates did tick up a little last month, but I think the holidays were the primary reason for our mini-slowdown and I expect activity to pick up significantly in the first quarter.
Whether you are considering selling your home or just want to keep it in top shape – almost every inspection report I see mentions the need to trim any vegetation around homes. Overhanging trees provide a highway for all sorts of vermin to invade attic spaces, causing potentially costly repairs. Now is a good time to trim back shrubs and limbs or hire a professional to do so. Another common item is disconnected ductwork in attics. Duct tape tends to degrade over time and this can lead to voids or separation. When warm, moist bathroom air accumulates in the attic rather than venting outside, the inevitable result is mold in the attic. It’s not uncommon to find no ductwork to the exterior, particularly in older homes. Fans should always vent to the outside, so if that is the case in your home, you’ll want to get the situation remedied as soon as possible. I have trusted professionals I can refer you to for both landscaping remediation and attic inspections/repairs.
29%
OF HOMES SOLD ABOVE LIST PRICE
65%
OF HOMES SOLD WITHIN 30 DAYS OR LESS
1.6
MONTHS SUPPLY OF AVAILABLE HOMES*
Median Closed Sales Price

*Months supply of available homes is calculated by dividing active inventory at the end of the month by pending. Pending sales are mutual purchase agreements that haven't closed yet.
**Graphs were created using data provided by Windermere Real Estate and NWMLS, but the information was not verified or published by NWMLS. Data reflects all new and resale single-family home sales, which include townhomes and exclude condos, for the month of December 2024.
December stats didn’t hold any surprises – market times increased as they typically do at this time. Eastside inventory decreased, but so did buyer activity so there wasn’t a significant change to pricing. Seattle was a little more impacted, with a decrease to the median price of both single family homes and condos. Interest rates did tick up a little last month, but I think the holidays were the primary reason for our mini-slowdown and I expect activity to pick up significantly in the first quarter.
Whether you are considering selling your home or just want to keep it in top shape – almost every inspection report I see mentions the need to trim any vegetation around homes. Overhanging trees provide a highway for all sorts of vermin to invade attic spaces, causing potentially costly repairs. Now is a good time to trim back shrubs and limbs or hire a professional to do so. Another common item is disconnected ductwork in attics. Duct tape tends to degrade over time and this can lead to voids or separation. When warm, moist bathroom air accumulates in the attic rather than venting outside, the inevitable result is mold in the attic. It’s not uncommon to find no ductwork to the exterior, particularly in older homes. Fans should always vent to the outside, so if that is the case in your home, you’ll want to get the situation remedied as soon as possible. I have trusted professionals I can refer you to for both landscaping remediation and attic inspections/repairs.
17%
OF HOMES SOLD ABOVE LIST PRICE
57%
OF HOMES SOLD WITHIN 30 DAYS OR LESS
1.8
MONTHS SUPPLY OF AVAILABLE HOMES*
Median Closed Sales Price

*Months supply of available homes is calculated by dividing active inventory at the end of the month by pending. Pending sales are mutual purchase agreements that haven't closed yet.
**Graphs were created using data provided by Windermere Real Estate and NWMLS, but the information was not verified or published by NWMLS. Data reflects all new and resale single-family home sales, which include townhomes and exclude condos, for the month of December 2024.
December stats didn’t hold any surprises – market times increased as they typically do at this time. Eastside inventory decreased, but so did buyer activity so there wasn’t a significant change to pricing. Seattle was a little more impacted, with a decrease to the median price of both single family homes and condos. Interest rates did tick up a little last month, but I think the holidays were the primary reason for our mini-slowdown and I expect activity to pick up significantly in the first quarter.
Whether you are considering selling your home or just want to keep it in top shape – almost every inspection report I see mentions the need to trim any vegetation around homes. Overhanging trees provide a highway for all sorts of vermin to invade attic spaces, causing potentially costly repairs. Now is a good time to trim back shrubs and limbs or hire a professional to do so. Another common item is disconnected ductwork in attics. Duct tape tends to degrade over time and this can lead to voids or separation. When warm, moist bathroom air accumulates in the attic rather than venting outside, the inevitable result is mold in the attic. It’s not uncommon to find no ductwork to the exterior, particularly in older homes. Fans should always vent to the outside, so if that is the case in your home, you’ll want to get the situation remedied as soon as possible. I have trusted professionals I can refer you to for both landscaping remediation and attic inspections/repairs.
22%
OF HOMES SOLD ABOVE LIST PRICE
61%
OF HOMES SOLD WITHIN 30 DAYS OR LESS
1.2
MONTHS SUPPLY OF AVAILABLE HOMES*
Median Closed Sales Price

*Months supply of available homes is calculated by dividing active inventory at the end of the month by pending. Pending sales are mutual purchase agreements that haven't closed yet.
**Graphs were created using data provided by Windermere Real Estate and NWMLS, but the information was not verified or published by NWMLS. Data reflects all new and resale single-family home sales, which include townhomes and exclude condos, for the month of December 2024.
December stats didn’t hold any surprises – market times increased as they typically do at this time. Eastside inventory decreased, but so did buyer activity so there wasn’t a significant change to pricing. Seattle was a little more impacted, with a decrease to the median price of both single family homes and condos. Interest rates did tick up a little last month, but I think the holidays were the primary reason for our mini-slowdown and I expect activity to pick up significantly in the first quarter.
Whether you are considering selling your home or just want to keep it in top shape – almost every inspection report I see mentions the need to trim any vegetation around homes. Overhanging trees provide a highway for all sorts of vermin to invade attic spaces, causing potentially costly repairs. Now is a good time to trim back shrubs and limbs or hire a professional to do so. Another common item is disconnected ductwork in attics. Duct tape tends to degrade over time and this can lead to voids or separation. When warm, moist bathroom air accumulates in the attic rather than venting outside, the inevitable result is mold in the attic. It’s not uncommon to find no ductwork to the exterior, particularly in older homes. Fans should always vent to the outside, so if that is the case in your home, you’ll want to get the situation remedied as soon as possible. I have trusted professionals I can refer you to for both landscaping remediation and attic inspections/repairs.
33%
OF HOMES SOLD ABOVE LIST PRICE
74%
OF HOMES SOLD WITHIN 30 DAYS OR LESS
1.5
MONTHS SUPPLY OF AVAILABLE HOMES*
Median Closed Sales Price

*Months supply of available homes is calculated by dividing active inventory at the end of the month by pending. Pending sales are mutual purchase agreements that haven't closed yet.
**Graphs were created using data provided by Windermere Real Estate and NWMLS, but the information was not verified or published by NWMLS. Data reflects all new and resale single-family home sales, which include townhomes and exclude condos, for the month of November 2024.
November’s statistics reflect our usual seasonal slowdown, magnified a bit on the Eastside due to widespread power outages. Despite that challenge, the median price of an Eastside Single Family Residence (SFR) decreased only slightly, demonstrating that demand still exceeds supply. Of greater significance, is that market times lengthened and more homes experienced a price adjustment before selling. This points out the importance of pricing a home based on current market conditions, not just past sales. Somewhat surprisingly, the Eastside condo market experienced a 7% drop to the median price in November, which may be explained by the disparity we see between higher-priced cottages (legally considered condos) and the downward pressure on older condominium values due to challenges with financing them. Interest rates are also more impactful at lower price points, so the ~half percent increase we saw last month may also be a factor.
Seattle’s SFR and condo markets experienced a slight decrease in their median prices with market times and price adjustments also increasing. Seattle condos remain a buyer’s market, but pricing has not dropped as much as might be expected, perhaps because the number of new units is dampening the problematic financing effect we are seeing for older complexes.
Our real estate market typically continues to slow in December due to the holidays, making it a good time to buy, despite lower inventory. The best time to list is usually late winter/early Spring (mid-January – mid-April) and I am counseling my sellers to be on the early side of that to optimize their outcome. Based on conversations with my clients and colleagues, I expect the first quarter of 2025 to be busy, with more options for buyers and pent-up demand for sellers.
22%
OF HOMES SOLD ABOVE LIST PRICE
68%
OF HOMES SOLD WITHIN 30 DAYS OR LESS
1.8
MONTHS SUPPLY OF AVAILABLE HOMES*
Median Closed Sales Price
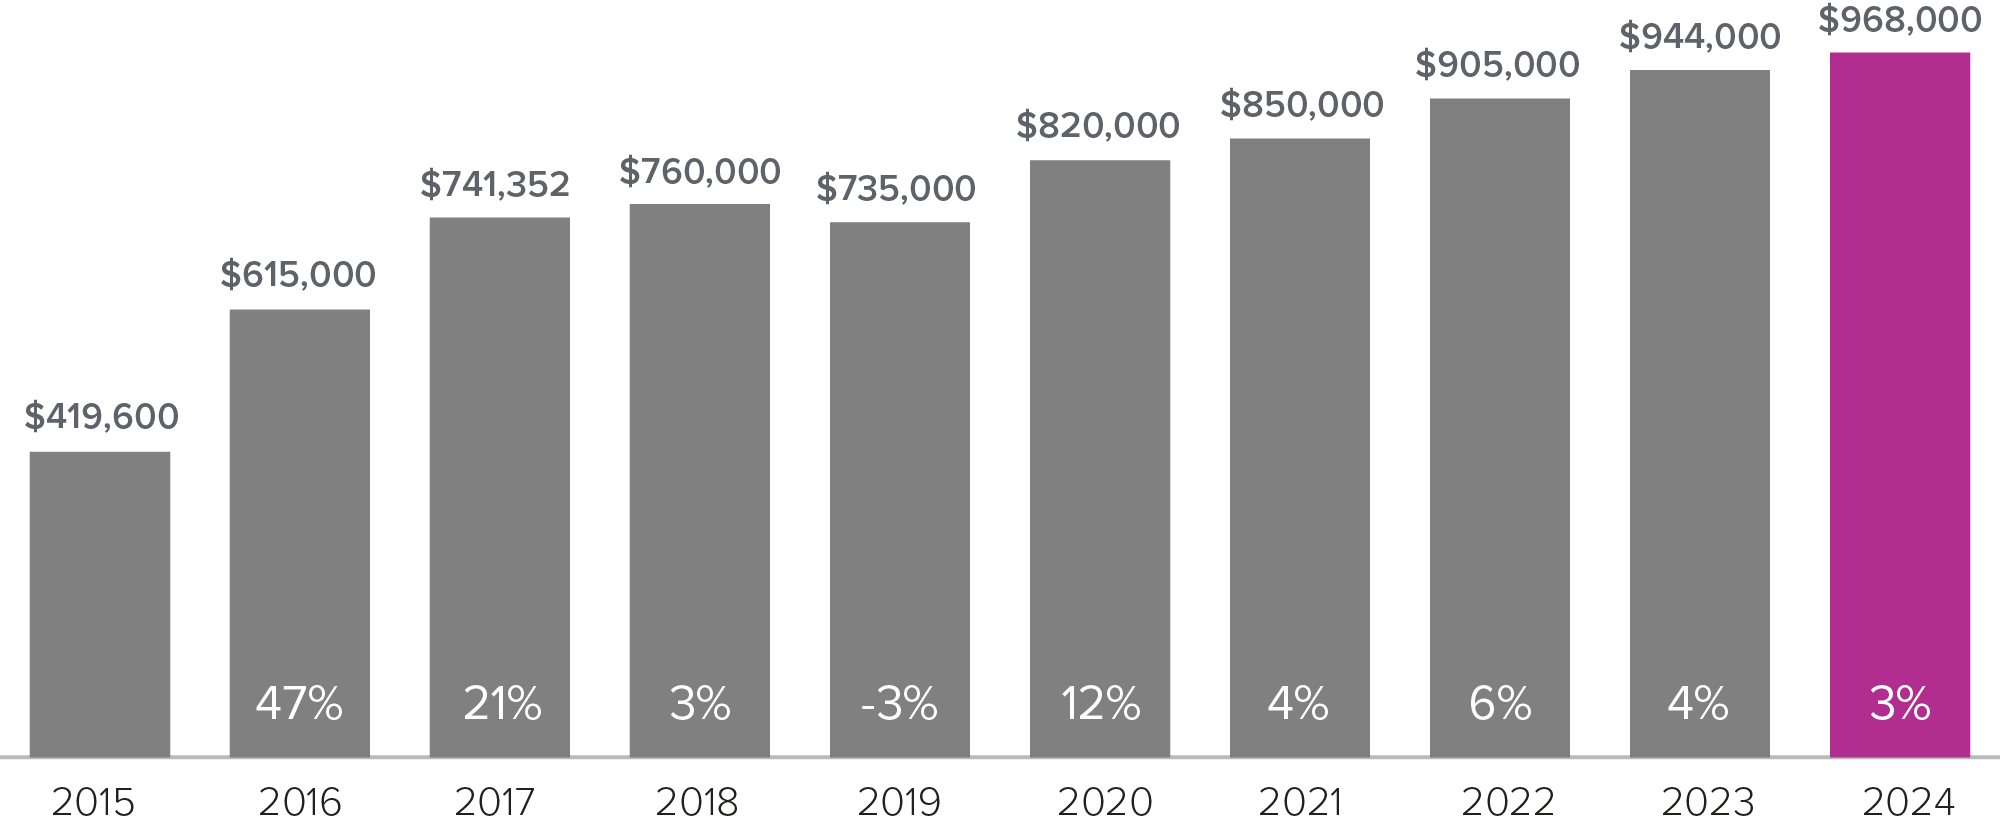
*Months supply of available homes is calculated by dividing active inventory at the end of the month by pending. Pending sales are mutual purchase agreements that haven't closed yet.
**Graphs were created using data provided by Windermere Real Estate and NWMLS, but the information was not verified or published by NWMLS. Data reflects all new and resale single-family home sales, which include townhomes and exclude condos, for the month of November 2024.
November’s statistics reflect our usual seasonal slowdown, magnified a bit on the Eastside due to widespread power outages. Despite that challenge, the median price of an Eastside Single Family Residence (SFR) decreased only slightly, demonstrating that demand still exceeds supply. Of greater significance, is that market times lengthened and more homes experienced a price adjustment before selling. This points out the importance of pricing a home based on current market conditions, not just past sales. Somewhat surprisingly, the Eastside condo market experienced a 7% drop to the median price in November, which may be explained by the disparity we see between higher-priced cottages (legally considered condos) and the downward pressure on older condominium values due to challenges with financing them. Interest rates are also more impactful at lower price points, so the ~half percent increase we saw last month may also be a factor.
Seattle’s SFR and condo markets experienced a slight decrease in their median prices with market times and price adjustments also increasing. Seattle condos remain a buyer’s market, but pricing has not dropped as much as might be expected, perhaps because the number of new units is dampening the problematic financing effect we are seeing for older complexes.
Our real estate market typically continues to slow in December due to the holidays, making it a good time to buy, despite lower inventory. The best time to list is usually late winter/early Spring (mid-January – mid-April) and I am counseling my sellers to be on the early side of that to optimize their outcome. Based on conversations with my clients and colleagues, I expect the first quarter of 2025 to be busy, with more options for buyers and pent-up demand for sellers.
23%
OF HOMES SOLD ABOVE LIST PRICE
70%
OF HOMES SOLD WITHIN 30 DAYS OR LESS
1.3
MONTHS SUPPLY OF AVAILABLE HOMES*
Median Closed Sales Price
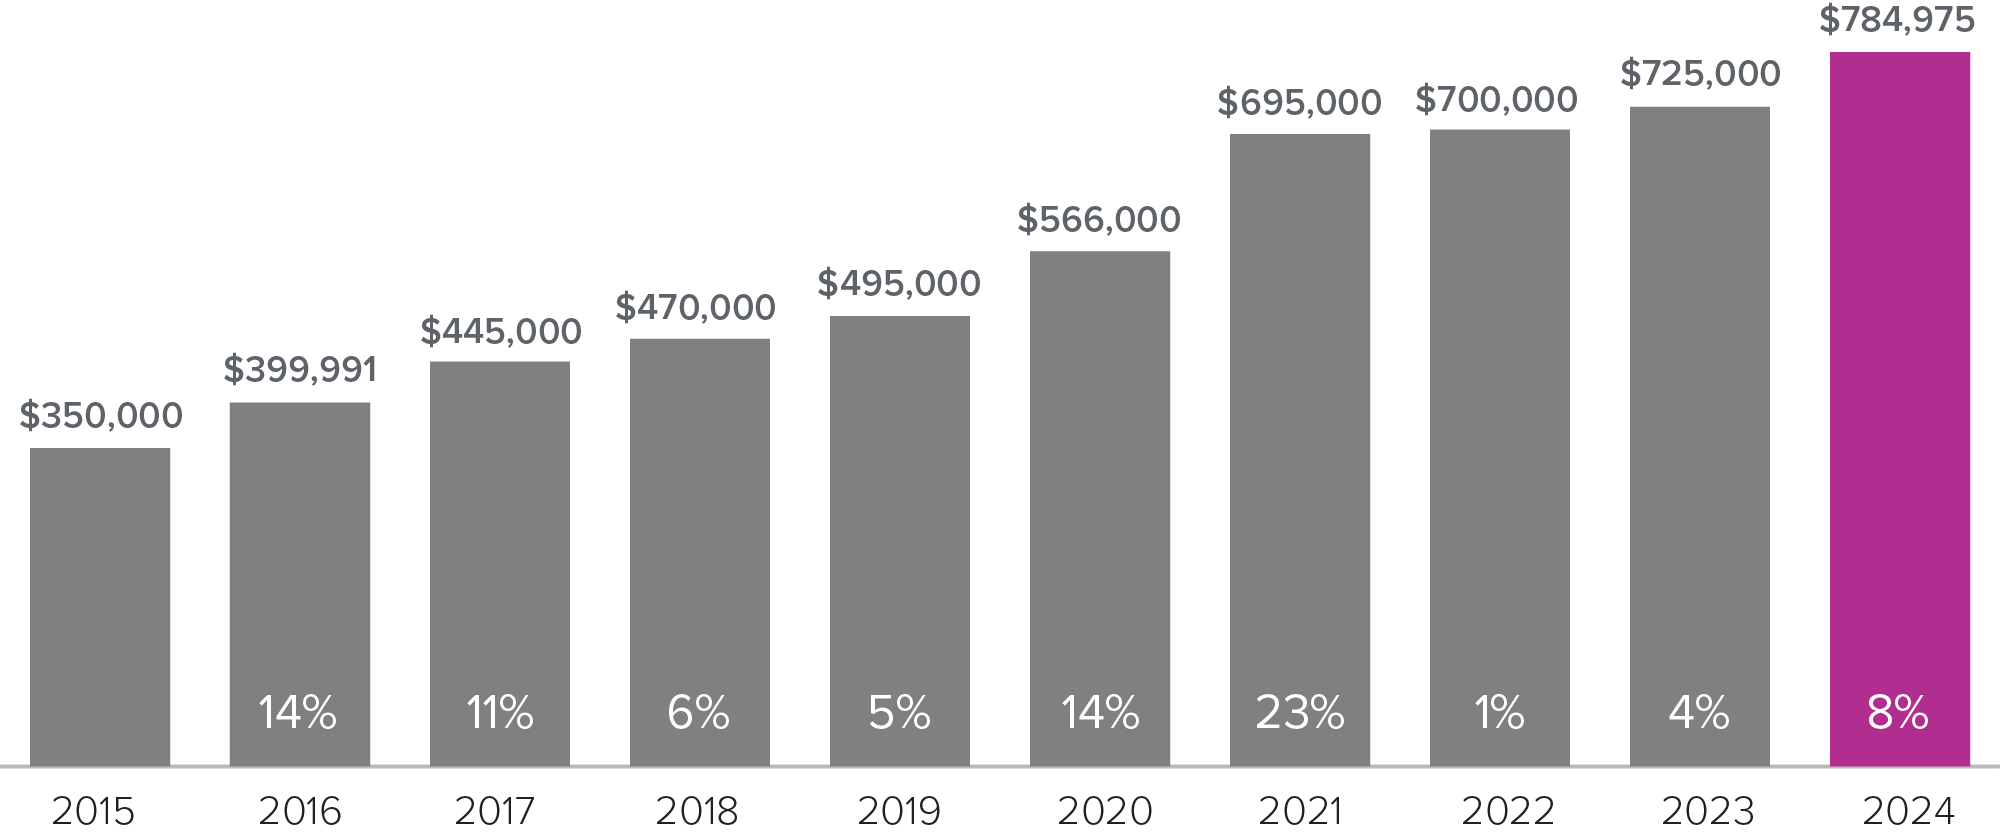
*Months supply of available homes is calculated by dividing active inventory at the end of the month by pending. Pending sales are mutual purchase agreements that haven't closed yet.
**Graphs were created using data provided by Windermere Real Estate and NWMLS, but the information was not verified or published by NWMLS. Data reflects all new and resale single-family home sales, which include townhomes and exclude condos, for the month of November 2024.
November’s statistics reflect our usual seasonal slowdown, magnified a bit on the Eastside due to widespread power outages. Despite that challenge, the median price of an Eastside Single Family Residence (SFR) decreased only slightly, demonstrating that demand still exceeds supply. Of greater significance, is that market times lengthened and more homes experienced a price adjustment before selling. This points out the importance of pricing a home based on current market conditions, not just past sales. Somewhat surprisingly, the Eastside condo market experienced a 7% drop to the median price in November, which may be explained by the disparity we see between higher-priced cottages (legally considered condos) and the downward pressure on older condominium values due to challenges with financing them. Interest rates are also more impactful at lower price points, so the ~half percent increase we saw last month may also be a factor.
Seattle’s SFR and condo markets experienced a slight decrease in their median prices with market times and price adjustments also increasing. Seattle condos remain a buyer’s market, but pricing has not dropped as much as might be expected, perhaps because the number of new units is dampening the problematic financing effect we are seeing for older complexes.
Our real estate market typically continues to slow in December due to the holidays, making it a good time to buy, despite lower inventory. The best time to list is usually late winter/early Spring (mid-January – mid-April) and I am counseling my sellers to be on the early side of that to optimize their outcome. Based on conversations with my clients and colleagues, I expect the first quarter of 2025 to be busy, with more options for buyers and pent-up demand for sellers.
33%
OF HOMES SOLD ABOVE LIST PRICE
74%
OF HOMES SOLD WITHIN 30 DAYS OR LESS
1.5
MONTHS SUPPLY OF AVAILABLE HOMES*
Median Closed Sales Price

*Months supply of available homes is calculated by dividing active inventory at the end of the month by pending. Pending sales are mutual purchase agreements that haven't closed yet.
**Graphs were created using data provided by Windermere Real Estate and NWMLS, but the information was not verified or published by NWMLS. Data reflects all new and resale single-family home sales, which include townhomes and exclude condos, for the month of November 2024.
November’s statistics reflect our usual seasonal slowdown, magnified a bit on the Eastside due to widespread power outages. Despite that challenge, the median price of an Eastside Single Family Residence (SFR) decreased only slightly, demonstrating that demand still exceeds supply. Of greater significance, is that market times lengthened and more homes experienced a price adjustment before selling. This points out the importance of pricing a home based on current market conditions, not just past sales. Somewhat surprisingly, the Eastside condo market experienced a 7% drop to the median price in November, which may be explained by the disparity we see between higher-priced cottages (legally considered condos) and the downward pressure on older condominium values due to challenges with financing them. Interest rates are also more impactful at lower price points, so the ~half percent increase we saw last month may also be a factor.
Seattle’s SFR and condo markets experienced a slight decrease in their median prices with market times and price adjustments also increasing. Seattle condos remain a buyer’s market, but pricing has not dropped as much as might be expected, perhaps because the number of new units is dampening the problematic financing effect we are seeing for older complexes.
Our real estate market typically continues to slow in December due to the holidays, making it a good time to buy, despite lower inventory. The best time to list is usually late winter/early Spring (mid-January – mid-April) and I am counseling my sellers to be on the early side of that to optimize their outcome. Based on conversations with my clients and colleagues, I expect the first quarter of 2025 to be busy, with more options for buyers and pent-up demand for sellers.
22%
OF HOMES SOLD ABOVE LIST PRICE
68%
OF HOMES SOLD WITHIN 30 DAYS OR LESS
1.8
MONTHS SUPPLY OF AVAILABLE HOMES*
Median Closed Sales Price

*Months supply of available homes is calculated by dividing active inventory at the end of the month by pending. Pending sales are mutual purchase agreements that haven't closed yet.
**Graphs were created using data provided by Windermere Real Estate and NWMLS, but the information was not verified or published by NWMLS. Data reflects all new and resale single-family home sales, which include townhomes and exclude condos, for the month of November 2024.
November’s statistics reflect our usual seasonal slowdown, magnified a bit on the Eastside due to widespread power outages. Despite that challenge, the median price of an Eastside Single Family Residence (SFR) decreased only slightly, demonstrating that demand still exceeds supply. Of greater significance, is that market times lengthened and more homes experienced a price adjustment before selling. This points out the importance of pricing a home based on current market conditions, not just past sales. Somewhat surprisingly, the Eastside condo market experienced a 7% drop to the median price in November, which may be explained by the disparity we see between higher-priced cottages (legally considered condos) and the downward pressure on older condominium values due to challenges with financing them. Interest rates are also more impactful at lower price points, so the ~half percent increase we saw last month may also be a factor.
Seattle’s SFR and condo markets experienced a slight decrease in their median prices with market times and price adjustments also increasing. Seattle condos remain a buyer’s market, but pricing has not dropped as much as might be expected, perhaps because the number of new units is dampening the problematic financing effect we are seeing for older complexes.
Our real estate market typically continues to slow in December due to the holidays, making it a good time to buy, despite lower inventory. The best time to list is usually late winter/early Spring (mid-January – mid-April) and I am counseling my sellers to be on the early side of that to optimize their outcome. Based on conversations with my clients and colleagues, I expect the first quarter of 2025 to be busy, with more options for buyers and pent-up demand for sellers.
23%
OF HOMES SOLD ABOVE LIST PRICE
70%
OF HOMES SOLD WITHIN 30 DAYS OR LESS
1.3
MONTHS SUPPLY OF AVAILABLE HOMES*
Median Closed Sales Price

*Months supply of available homes is calculated by dividing active inventory at the end of the month by pending. Pending sales are mutual purchase agreements that haven't closed yet.
**Graphs were created using data provided by Windermere Real Estate and NWMLS, but the information was not verified or published by NWMLS. Data reflects all new and resale single-family home sales, which include townhomes and exclude condos, for the month of November 2024.
November’s statistics reflect our usual seasonal slowdown, magnified a bit on the Eastside due to widespread power outages. Despite that challenge, the median price of an Eastside Single Family Residence (SFR) decreased only slightly, demonstrating that demand still exceeds supply. Of greater significance, is that market times lengthened and more homes experienced a price adjustment before selling. This points out the importance of pricing a home based on current market conditions, not just past sales. Somewhat surprisingly, the Eastside condo market experienced a 7% drop to the median price in November, which may be explained by the disparity we see between higher-priced cottages (legally considered condos) and the downward pressure on older condominium values due to challenges with financing them. Interest rates are also more impactful at lower price points, so the ~half percent increase we saw last month may also be a factor.
Seattle’s SFR and condo markets experienced a slight decrease in their median prices with market times and price adjustments also increasing. Seattle condos remain a buyer’s market, but pricing has not dropped as much as might be expected, perhaps because the number of new units is dampening the problematic financing effect we are seeing for older complexes.
Our real estate market typically continues to slow in December due to the holidays, making it a good time to buy, despite lower inventory. The best time to list is usually late winter/early Spring (mid-January – mid-April) and I am counseling my sellers to be on the early side of that to optimize their outcome. Based on conversations with my clients and colleagues, I expect the first quarter of 2025 to be busy, with more options for buyers and pent-up demand for sellers.
37%
OF HOMES SOLD ABOVE LIST PRICE
74%
OF HOMES SOLD WITHIN 30 DAYS OR LESS
1.2
MONTHS SUPPLY OF AVAILABLE HOMES*
Median Closed Sales Price
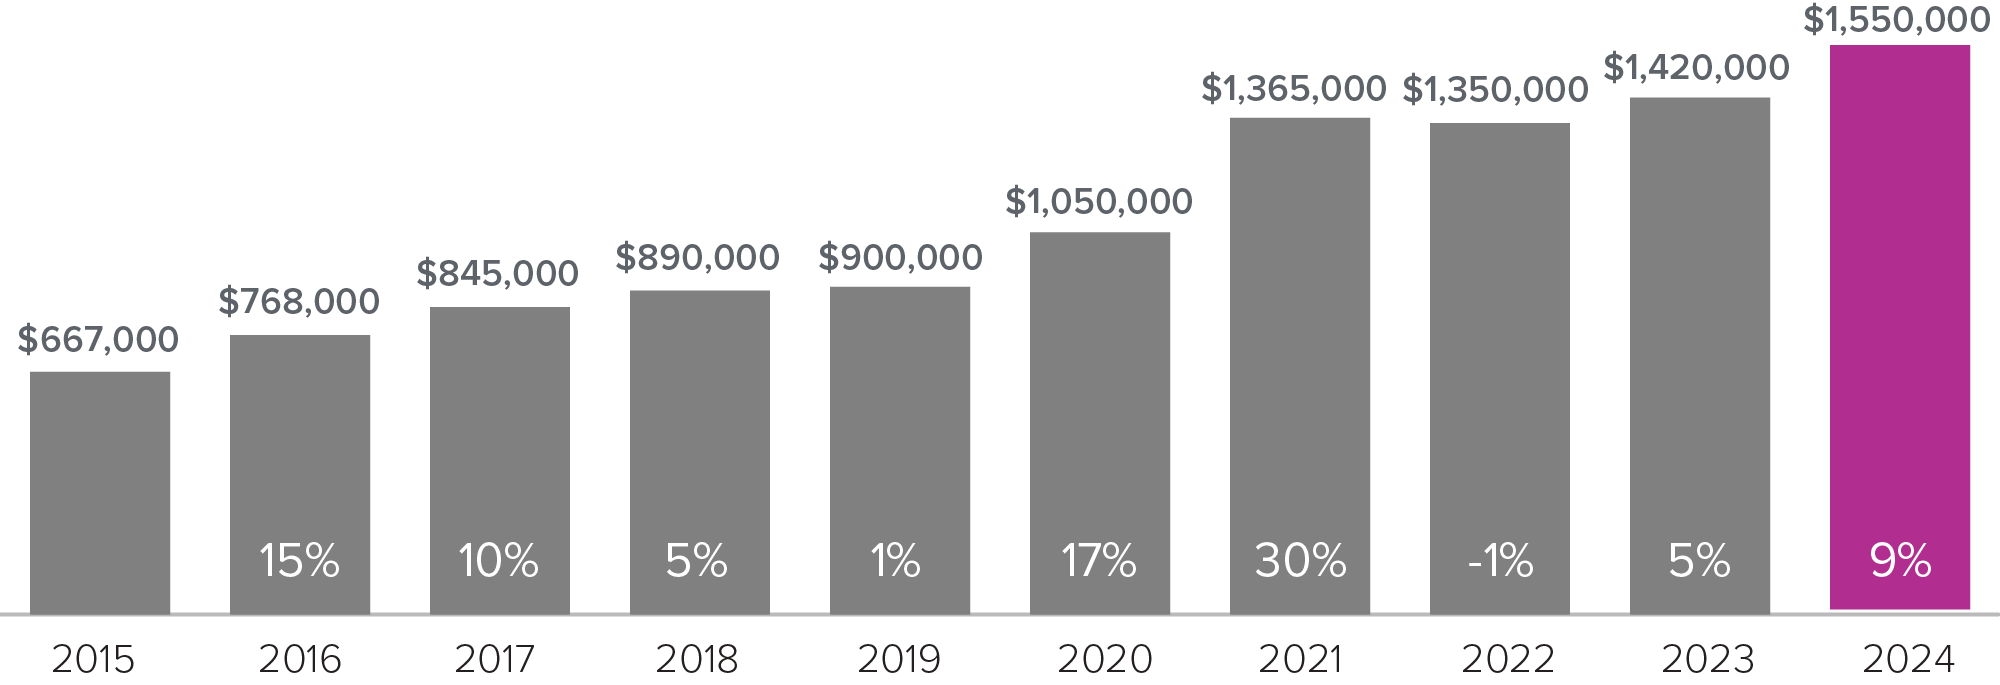
*Months supply of available homes is calculated by dividing active inventory at the end of the month by pending. Pending sales are mutual purchase agreements that haven't closed yet.
**Graphs were created using data provided by Windermere Real Estate and NWMLS, but the information was not verified or published by NWMLS. Data reflects all new and resale single-family home sales, which include townhomes and exclude condos, for the month of October 2024.
Eastside Single Family Residence (SFR) stats for October are similar to September’s, with a slight increase to the median price. As always, a well-presented, professionally marketed home sells quickly with multiple offers. My recent Kirkland listing is a great example. We received 11 offers in just a few days and it sold for $350,000 over list price!
October saw another spike (7%) in the median cost of a condo. I continue to believe this is primarily due to the increasing number of cottages and Detached Additional Dwelling Units (DADUs) being sold. Though they are technically condos, they typically do not share walls and have minimal HOA dues making them an attractive new option for both downsizers and first-time homebuyers. Another benefit is that, due to being new construction and having minimal (or no) common areas, they do not have the maintenance and reserve requirements associated with older, traditional condominiums.
The median price of a Seattle SFR increased a little to $972,500 while the condo median price fell 4% to $580,000. This is mostly explained by the typical increase in sales we see in September, tempered by the surplus of Seattle condo inventory. In both Seattle and on the Eastside, closed sales increased 50% in October vs September, indicating that our market remains robust.
Late Fall/early winter tends to be a slower market with holidays approaching. It can be an excellent time to buy as there is less competition. Many sellers are waiting to list until January, when the market tends to pick up. The increase in inventory gives buyers more to choose from, but competition tends to also heat up after the holidays, so buyers would do well to jump in as early as possible.
32%
OF HOMES SOLD ABOVE LIST PRICE
77%
OF HOMES SOLD WITHIN 30 DAYS OR LESS
1.8
MONTHS SUPPLY OF AVAILABLE HOMES*
Median Closed Sales Price
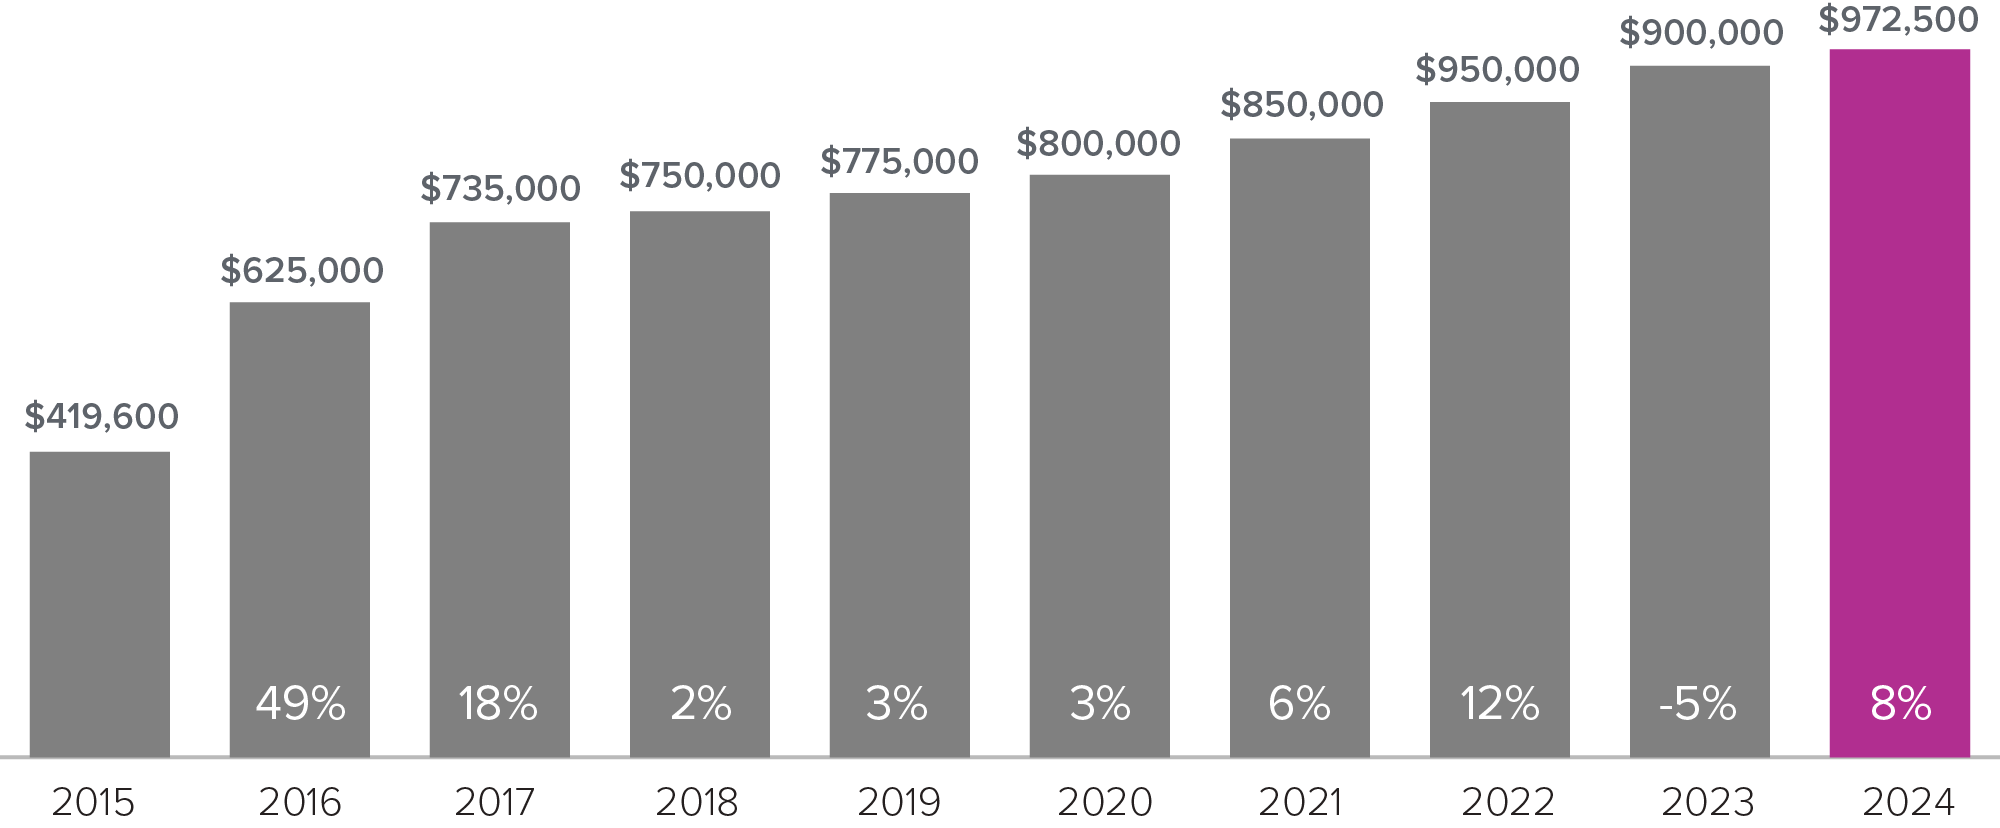
*Months supply of available homes is calculated by dividing active inventory at the end of the month by pending. Pending sales are mutual purchase agreements that haven't closed yet.
**Graphs were created using data provided by Windermere Real Estate and NWMLS, but the information was not verified or published by NWMLS. Data reflects all new and resale single-family home sales, which include townhomes and exclude condos, for the month of October 2024.
Eastside Single Family Residence (SFR) stats for October are similar to September’s, with a slight increase to the median price. As always, a well-presented, professionally marketed home sells quickly with multiple offers. My recent Kirkland listing is a great example. We received 11 offers in just a few days and it sold for $350,000 over list price!
October saw another spike (7%) in the median cost of a condo. I continue to believe this is primarily due to the increasing number of cottages and Detached Additional Dwelling Units (DADUs) being sold. Though they are technically condos, they typically do not share walls and have minimal HOA dues making them an attractive new option for both downsizers and first-time homebuyers. Another benefit is that, due to being new construction and having minimal (or no) common areas, they do not have the maintenance and reserve requirements associated with older, traditional condominiums.
The median price of a Seattle SFR increased a little to $972,500 while the condo median price fell 4% to $580,000. This is mostly explained by the typical increase in sales we see in September, tempered by the surplus of Seattle condo inventory. In both Seattle and on the Eastside, closed sales increased 50% in October vs September, indicating that our market remains robust.
Late Fall/early winter tends to be a slower market with holidays approaching. It can be an excellent time to buy as there is less competition. Many sellers are waiting to list until January, when the market tends to pick up. The increase in inventory gives buyers more to choose from, but competition tends to also heat up after the holidays, so buyers would do well to jump in as early as possible.
26%
OF HOMES SOLD ABOVE LIST PRICE
69%
OF HOMES SOLD WITHIN 30 DAYS OR LESS
1.4
MONTHS SUPPLY OF AVAILABLE HOMES*
Median Closed Sales Price
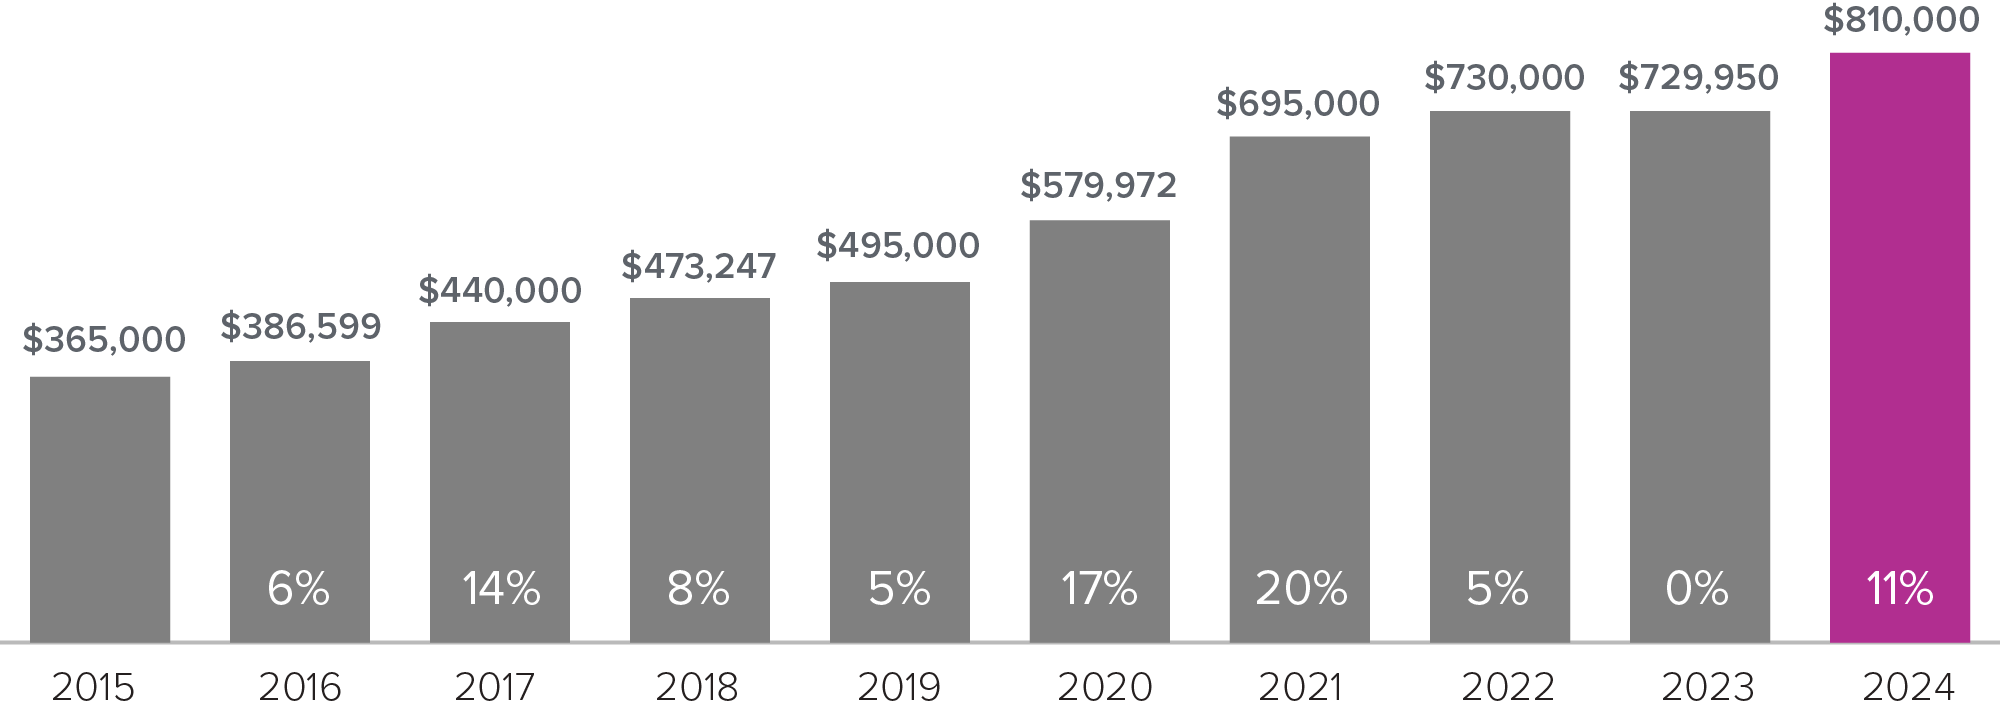
*Months supply of available homes is calculated by dividing active inventory at the end of the month by pending. Pending sales are mutual purchase agreements that haven't closed yet.
**Graphs were created using data provided by Windermere Real Estate and NWMLS, but the information was not verified or published by NWMLS. Data reflects all new and resale single-family home sales, which include townhomes and exclude condos, for the month of October 2024.
Eastside Single Family Residence (SFR) stats for October are similar to September’s, with a slight increase to the median price. As always, a well-presented, professionally marketed home sells quickly with multiple offers. My recent Kirkland listing is a great example. We received 11 offers in just a few days and it sold for $350,000 over list price!
October saw another spike (7%) in the median cost of a condo. I continue to believe this is primarily due to the increasing number of cottages and Detached Additional Dwelling Units (DADUs) being sold. Though they are technically condos, they typically do not share walls and have minimal HOA dues making them an attractive new option for both downsizers and first-time homebuyers. Another benefit is that, due to being new construction and having minimal (or no) common areas, they do not have the maintenance and reserve requirements associated with older, traditional condominiums.
The median price of a Seattle SFR increased a little to $972,500 while the condo median price fell 4% to $580,000. This is mostly explained by the typical increase in sales we see in September, tempered by the surplus of Seattle condo inventory. In both Seattle and on the Eastside, closed sales increased 50% in October vs September, indicating that our market remains robust.
Late Fall/early winter tends to be a slower market with holidays approaching. It can be an excellent time to buy as there is less competition. Many sellers are waiting to list until January, when the market tends to pick up. The increase in inventory gives buyers more to choose from, but competition tends to also heat up after the holidays, so buyers would do well to jump in as early as possible.
37%
OF HOMES SOLD ABOVE LIST PRICE
74%
OF HOMES SOLD WITHIN 30 DAYS OR LESS
1.2
MONTHS SUPPLY OF AVAILABLE HOMES*
Median Closed Sales Price

*Months supply of available homes is calculated by dividing active inventory at the end of the month by pending. Pending sales are mutual purchase agreements that haven't closed yet.
**Graphs were created using data provided by Windermere Real Estate and NWMLS, but the information was not verified or published by NWMLS. Data reflects all new and resale single-family home sales, which include townhomes and exclude condos, for the month of October 2024.
Eastside Single Family Residence (SFR) stats for October are similar to September’s, with a slight increase to the median price. As always, a well-presented, professionally marketed home sells quickly with multiple offers. My recent Kirkland listing is a great example. We received 11 offers in just a few days and it sold for $350,000 over list price!
October saw another spike (7%) in the median cost of a condo. I continue to believe this is primarily due to the increasing number of cottages and Detached Additional Dwelling Units (DADUs) being sold. Though they are technically condos, they typically do not share walls and have minimal HOA dues making them an attractive new option for both downsizers and first-time homebuyers. Another benefit is that, due to being new construction and having minimal (or no) common areas, they do not have the maintenance and reserve requirements associated with older, traditional condominiums.
The median price of a Seattle SFR increased a little to $972,500 while the condo median price fell 4% to $580,000. This is mostly explained by the typical increase in sales we see in September, tempered by the surplus of Seattle condo inventory. In both Seattle and on the Eastside, closed sales increased 50% in October vs September, indicating that our market remains robust.
Late Fall/early winter tends to be a slower market with holidays approaching. It can be an excellent time to buy as there is less competition. Many sellers are waiting to list until January, when the market tends to pick up. The increase in inventory gives buyers more to choose from, but competition tends to also heat up after the holidays, so buyers would do well to jump in as early as possible.
32%
OF HOMES SOLD ABOVE LIST PRICE
77%
OF HOMES SOLD WITHIN 30 DAYS OR LESS
1.8
MONTHS SUPPLY OF AVAILABLE HOMES*
Median Closed Sales Price

*Months supply of available homes is calculated by dividing active inventory at the end of the month by pending. Pending sales are mutual purchase agreements that haven't closed yet.
**Graphs were created using data provided by Windermere Real Estate and NWMLS, but the information was not verified or published by NWMLS. Data reflects all new and resale single-family home sales, which include townhomes and exclude condos, for the month of October 2024.
Eastside Single Family Residence (SFR) stats for October are similar to September’s, with a slight increase to the median price. As always, a well-presented, professionally marketed home sells quickly with multiple offers. My recent Kirkland listing is a great example. We received 11 offers in just a few days and it sold for $350,000 over list price!
October saw another spike (7%) in the median cost of a condo. I continue to believe this is primarily due to the increasing number of cottages and Detached Additional Dwelling Units (DADUs) being sold. Though they are technically condos, they typically do not share walls and have minimal HOA dues making them an attractive new option for both downsizers and first-time homebuyers. Another benefit is that, due to being new construction and having minimal (or no) common areas, they do not have the maintenance and reserve requirements associated with older, traditional condominiums.
The median price of a Seattle SFR increased a little to $972,500 while the condo median price fell 4% to $580,000. This is mostly explained by the typical increase in sales we see in September, tempered by the surplus of Seattle condo inventory. In both Seattle and on the Eastside, closed sales increased 50% in October vs September, indicating that our market remains robust.
Late Fall/early winter tends to be a slower market with holidays approaching. It can be an excellent time to buy as there is less competition. Many sellers are waiting to list until January, when the market tends to pick up. The increase in inventory gives buyers more to choose from, but competition tends to also heat up after the holidays, so buyers would do well to jump in as early as possible.
26%
OF HOMES SOLD ABOVE LIST PRICE
69%
OF HOMES SOLD WITHIN 30 DAYS OR LESS
1.4
MONTHS SUPPLY OF AVAILABLE HOMES*
Median Closed Sales Price

*Months supply of available homes is calculated by dividing active inventory at the end of the month by pending. Pending sales are mutual purchase agreements that haven't closed yet.
**Graphs were created using data provided by Windermere Real Estate and NWMLS, but the information was not verified or published by NWMLS. Data reflects all new and resale single-family home sales, which include townhomes and exclude condos, for the month of October 2024.
Eastside Single Family Residence (SFR) stats for October are similar to September’s, with a slight increase to the median price. As always, a well-presented, professionally marketed home sells quickly with multiple offers. My recent Kirkland listing is a great example. We received 11 offers in just a few days and it sold for $350,000 over list price!
October saw another spike (7%) in the median cost of a condo. I continue to believe this is primarily due to the increasing number of cottages and Detached Additional Dwelling Units (DADUs) being sold. Though they are technically condos, they typically do not share walls and have minimal HOA dues making them an attractive new option for both downsizers and first-time homebuyers. Another benefit is that, due to being new construction and having minimal (or no) common areas, they do not have the maintenance and reserve requirements associated with older, traditional condominiums.
The median price of a Seattle SFR increased a little to $972,500 while the condo median price fell 4% to $580,000. This is mostly explained by the typical increase in sales we see in September, tempered by the surplus of Seattle condo inventory. In both Seattle and on the Eastside, closed sales increased 50% in October vs September, indicating that our market remains robust.
Late Fall/early winter tends to be a slower market with holidays approaching. It can be an excellent time to buy as there is less competition. Many sellers are waiting to list until January, when the market tends to pick up. The increase in inventory gives buyers more to choose from, but competition tends to also heat up after the holidays, so buyers would do well to jump in as early as possible.
35%
OF HOMES SOLD ABOVE LIST PRICE
83%
OF HOMES SOLD WITHIN 30 DAYS OR LESS
1.5
MONTHS SUPPLY OF AVAILABLE HOMES*
Median Closed Sales Price

*Months supply of available homes is calculated by dividing active inventory at the end of the month by pending. Pending sales are mutual purchase agreements that haven't closed yet.
**Graphs were created using data provided by Windermere Real Estate and NWMLS, but the information was not verified or published by NWMLS. Data reflects all new and resale single-family home sales, which include townhomes and exclude condos, for the month of September 2024.
There is a saying in real estate that if you want business to pick up, just plan a vacation. That was certainly true last month as I sold 5 homes in the two weeks prior to leaving the country! My 2 listings received multiple offers and my 3 buyers found just the homes they wanted, at a great price and terms, without having to compete. My experience mirrors the September stats – inventory increased slightly and interest rates improved, creating opportunities for buyers. Prices didn’t change much due to increasing demand, so it remains a good time to sell.
The condo market in both Seattle and the Eastside is a bit of an anomaly. Despite increased inventory (Seattle is now firmly a buyer’s market for condos), the median price went up 12% on the Eastside to $690,000 and 9% in Seattle to $606,000. This may be due to the increase in the number of cottages and detached units (DADUs) that are technically considered condos and sell for higher prices. For traditional condos, lending has tightened up significantly since the condo collapse in Florida. Lenders and insurance companies are scrutinizing reserve studies, maintenance issues, and assessment potential. It’s critical to do your research and to work with an experienced agent and lender, particularly if you are considering an older complex.
30%
OF HOMES SOLD ABOVE LIST PRICE
72%
OF HOMES SOLD WITHIN 30 DAYS OR LESS
1.9
MONTHS SUPPLY OF AVAILABLE HOMES*
Median Closed Sales Price
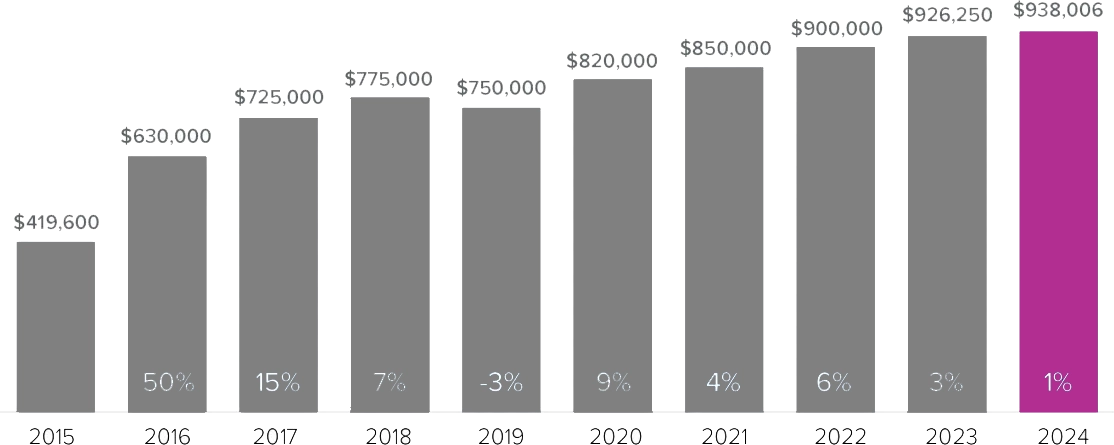
*Months supply of available homes is calculated by dividing active inventory at the end of the month by pending. Pending sales are mutual purchase agreements that haven't closed yet.
**Graphs were created using data provided by Windermere Real Estate and NWMLS, but the information was not verified or published by NWMLS. Data reflects all new and resale single-family home sales, which include townhomes and exclude condos, for the month of September 2024.
There is a saying in real estate that if you want business to pick up, just plan a vacation. That was certainly true last month as I sold 5 homes in the two weeks prior to leaving the country! My 2 listings received multiple offers and my 3 buyers found just the homes they wanted, at a great price and terms, without having to compete. My experience mirrors the September stats – inventory increased slightly and interest rates improved, creating opportunities for buyers. Prices didn’t change much due to increasing demand, so it remains a good time to sell.
The condo market in both Seattle and the Eastside is a bit of an anomaly. Despite increased inventory (Seattle is now firmly a buyer’s market for condos), the median price went up 12% on the Eastside to $690,000 and 9% in Seattle to $606,000. This may be due to the increase in the number of cottages and detached units (DADUs) that are technically considered condos and sell for higher prices. For traditional condos, lending has tightened up significantly since the condo collapse in Florida. Lenders and insurance companies are scrutinizing reserve studies, maintenance issues, and assessment potential. It’s critical to do your research and to work with an experienced agent and lender, particularly if you are considering an older complex.
26%
OF HOMES SOLD ABOVE LIST PRICE
74%
OF HOMES SOLD WITHIN 30 DAYS OR LESS
1.4
MONTHS SUPPLY OF AVAILABLE HOMES*
Median Closed Sales Price
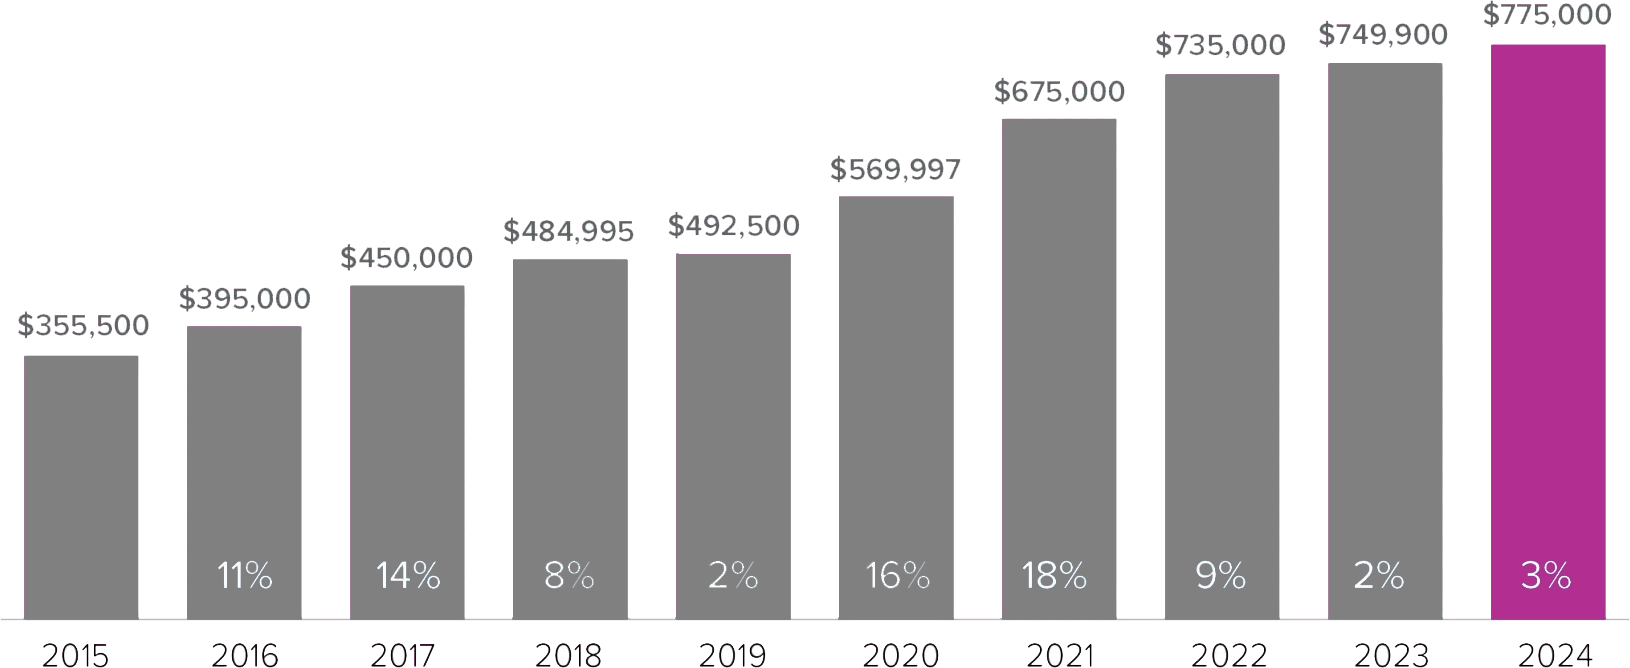
*Months supply of available homes is calculated by dividing active inventory at the end of the month by pending. Pending sales are mutual purchase agreements that haven't closed yet.
**Graphs were created using data provided by Windermere Real Estate and NWMLS, but the information was not verified or published by NWMLS. Data reflects all new and resale single-family home sales, which include townhomes and exclude condos, for the month of September 2024.
There is a saying in real estate that if you want business to pick up, just plan a vacation. That was certainly true last month as I sold 5 homes in the two weeks prior to leaving the country! My 2 listings received multiple offers and my 3 buyers found just the homes they wanted, at a great price and terms, without having to compete. My experience mirrors the September stats – inventory increased slightly and interest rates improved, creating opportunities for buyers. Prices didn’t change much due to increasing demand, so it remains a good time to sell.
The condo market in both Seattle and the Eastside is a bit of an anomaly. Despite increased inventory (Seattle is now firmly a buyer’s market for condos), the median price went up 12% on the Eastside to $690,000 and 9% in Seattle to $606,000. This may be due to the increase in the number of cottages and detached units (DADUs) that are technically considered condos and sell for higher prices. For traditional condos, lending has tightened up significantly since the condo collapse in Florida. Lenders and insurance companies are scrutinizing reserve studies, maintenance issues, and assessment potential. It’s critical to do your research and to work with an experienced agent and lender, particularly if you are considering an older complex.
35%
OF HOMES SOLD ABOVE LIST PRICE
83%
OF HOMES SOLD WITHIN 30 DAYS OR LESS
1.5
MONTHS SUPPLY OF AVAILABLE HOMES*
Median Closed Sales Price

*Months supply of available homes is calculated by dividing active inventory at the end of the month by pending. Pending sales are mutual purchase agreements that haven't closed yet.
**Graphs were created using data provided by Windermere Real Estate and NWMLS, but the information was not verified or published by NWMLS. Data reflects all new and resale single-family home sales, which include townhomes and exclude condos, for the month of September 2024.
There is a saying in real estate that if you want business to pick up, just plan a vacation. That was certainly true last month as I sold 5 homes in the two weeks prior to leaving the country! My 2 listings received multiple offers and my 3 buyers found just the homes they wanted, at a great price and terms, without having to compete. My experience mirrors the September stats – inventory increased slightly and interest rates improved, creating opportunities for buyers. Prices didn’t change much due to increasing demand, so it remains a good time to sell.
The condo market in both Seattle and the Eastside is a bit of an anomaly. Despite increased inventory (Seattle is now firmly a buyer’s market for condos), the median price went up 12% on the Eastside to $690,000 and 9% in Seattle to $606,000. This may be due to the increase in the number of cottages and detached units (DADUs) that are technically considered condos and sell for higher prices. For traditional condos, lending has tightened up significantly since the condo collapse in Florida. Lenders and insurance companies are scrutinizing reserve studies, maintenance issues, and assessment potential. It’s critical to do your research and to work with an experienced agent and lender, particularly if you are considering an older complex.
30%
OF HOMES SOLD ABOVE LIST PRICE
72%
OF HOMES SOLD WITHIN 30 DAYS OR LESS
1.9
MONTHS SUPPLY OF AVAILABLE HOMES*
Median Closed Sales Price

*Months supply of available homes is calculated by dividing active inventory at the end of the month by pending. Pending sales are mutual purchase agreements that haven't closed yet.
**Graphs were created using data provided by Windermere Real Estate and NWMLS, but the information was not verified or published by NWMLS. Data reflects all new and resale single-family home sales, which include townhomes and exclude condos, for the month of September 2024.
There is a saying in real estate that if you want business to pick up, just plan a vacation. That was certainly true last month as I sold 5 homes in the two weeks prior to leaving the country! My 2 listings received multiple offers and my 3 buyers found just the homes they wanted, at a great price and terms, without having to compete. My experience mirrors the September stats – inventory increased slightly and interest rates improved, creating opportunities for buyers. Prices didn’t change much due to increasing demand, so it remains a good time to sell.
The condo market in both Seattle and the Eastside is a bit of an anomaly. Despite increased inventory (Seattle is now firmly a buyer’s market for condos), the median price went up 12% on the Eastside to $690,000 and 9% in Seattle to $606,000. This may be due to the increase in the number of cottages and detached units (DADUs) that are technically considered condos and sell for higher prices. For traditional condos, lending has tightened up significantly since the condo collapse in Florida. Lenders and insurance companies are scrutinizing reserve studies, maintenance issues, and assessment potential. It’s critical to do your research and to work with an experienced agent and lender, particularly if you are considering an older complex.
26%
OF HOMES SOLD ABOVE LIST PRICE
74%
OF HOMES SOLD WITHIN 30 DAYS OR LESS
1.4
MONTHS SUPPLY OF AVAILABLE HOMES*
Median Closed Sales Price

*Months supply of available homes is calculated by dividing active inventory at the end of the month by pending. Pending sales are mutual purchase agreements that haven't closed yet.
**Graphs were created using data provided by Windermere Real Estate and NWMLS, but the information was not verified or published by NWMLS. Data reflects all new and resale single-family home sales, which include townhomes and exclude condos, for the month of September 2024.
There is a saying in real estate that if you want business to pick up, just plan a vacation. That was certainly true last month as I sold 5 homes in the two weeks prior to leaving the country! My 2 listings received multiple offers and my 3 buyers found just the homes they wanted, at a great price and terms, without having to compete. My experience mirrors the September stats – inventory increased slightly and interest rates improved, creating opportunities for buyers. Prices didn’t change much due to increasing demand, so it remains a good time to sell.
The condo market in both Seattle and the Eastside is a bit of an anomaly. Despite increased inventory (Seattle is now firmly a buyer’s market for condos), the median price went up 12% on the Eastside to $690,000 and 9% in Seattle to $606,000. This may be due to the increase in the number of cottages and detached units (DADUs) that are technically considered condos and sell for higher prices. For traditional condos, lending has tightened up significantly since the condo collapse in Florida. Lenders and insurance companies are scrutinizing reserve studies, maintenance issues, and assessment potential. It’s critical to do your research and to work with an experienced agent and lender, particularly if you are considering an older complex.
39%
OF HOMES SOLD ABOVE LIST PRICE
82%
OF HOMES SOLD WITHIN 30 DAYS OR LESS
1.4
MONTHS SUPPLY OF AVAILABLE HOMES*
Median Closed Sales Price
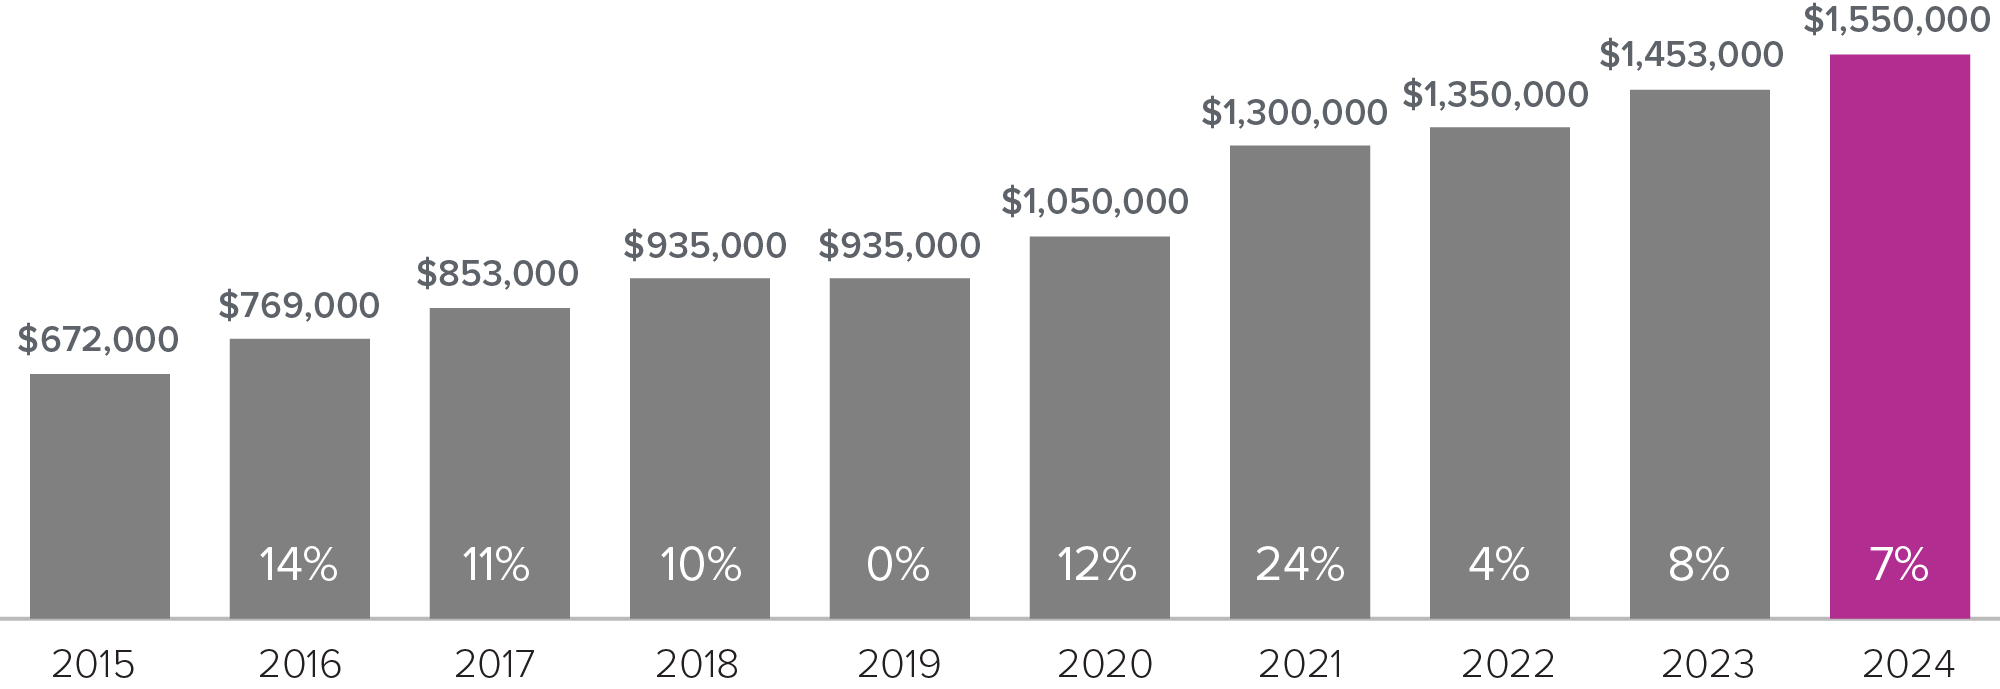
*Months supply of available homes is calculated by dividing active inventory at the end of the month by pending. Pending sales are mutual purchase agreements that haven't closed yet.
**Graphs were created using data provided by Windermere Real Estate and NWMLS, but the information was not verified or published by NWMLS. Data reflects all new and resale single-family home sales, which include townhomes and exclude condos, for the month of August 2024.
31%
OF HOMES SOLD ABOVE LIST PRICE
78%
OF HOMES SOLD WITHIN 30 DAYS OR LESS
2.0
MONTHS SUPPLY OF AVAILABLE HOMES*
Median Closed Sales Price
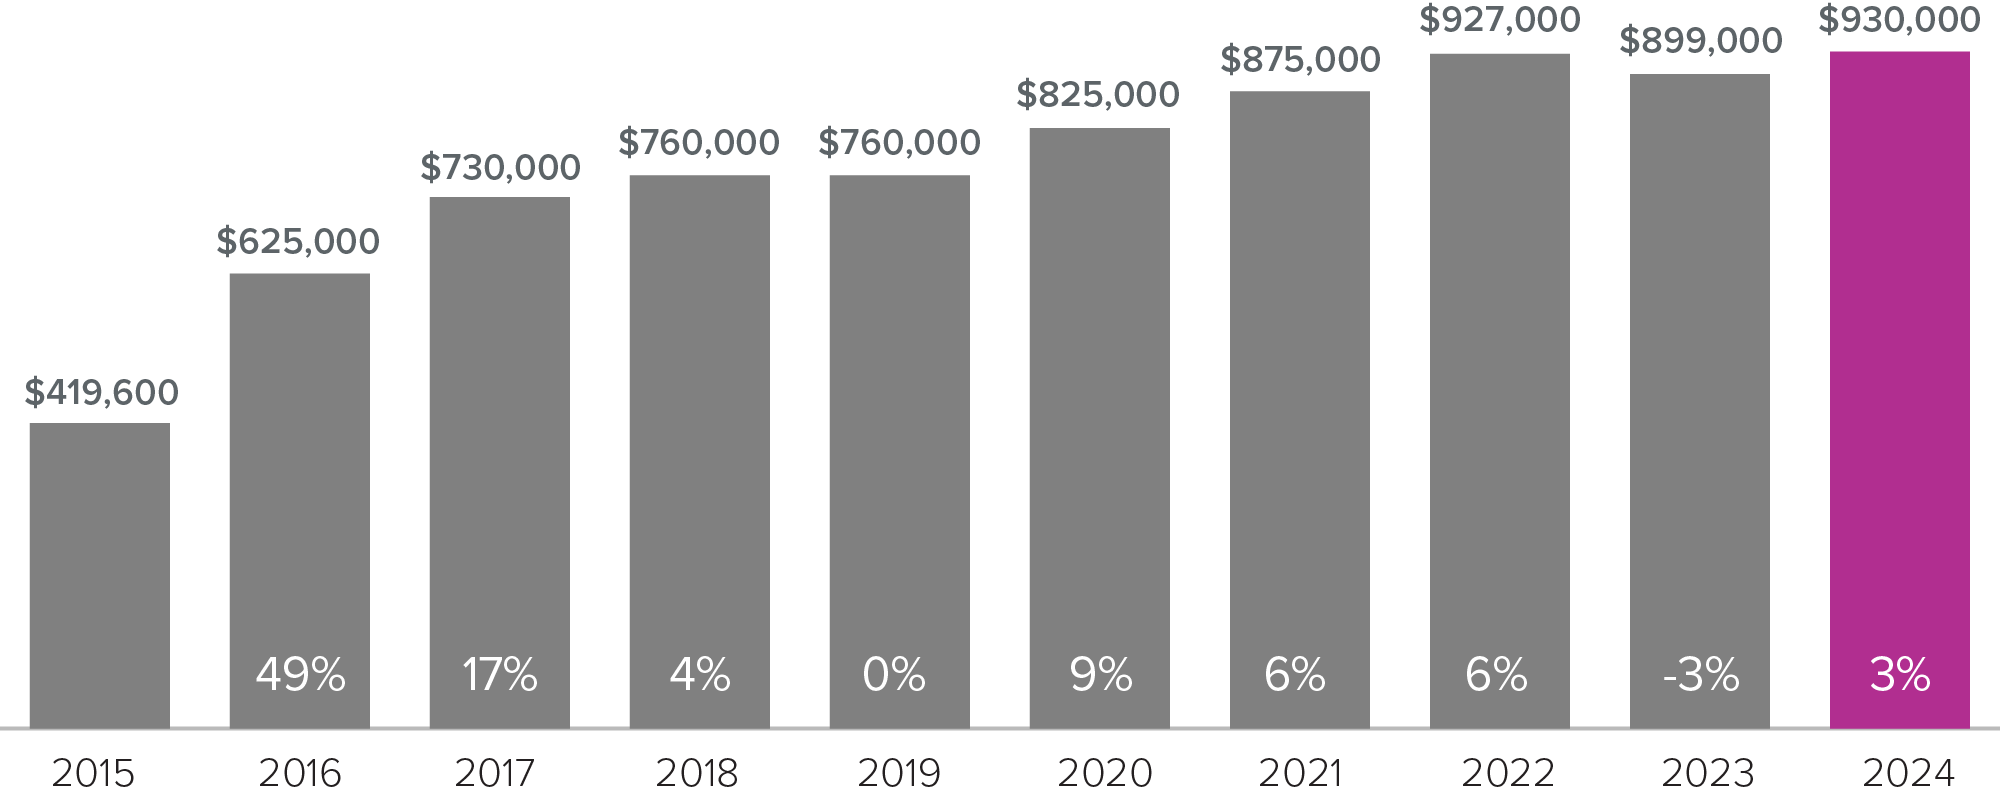
*Months supply of available homes is calculated by dividing active inventory at the end of the month by pending. Pending sales are mutual purchase agreements that haven't closed yet.
**Graphs were created using data provided by Windermere Real Estate and NWMLS, but the information was not verified or published by NWMLS. Data reflects all new and resale single-family home sales, which include townhomes and exclude condos, for the month of August 2024.
August played out as I expected with the slower market reflected in a 4.3% reduction in the median price of a Single Family Residence (SFR) in both Seattle and the Eastside. The number of homes selling at or above list price also decreased a little in both areas and the length of time on market increased. While inventory is rising slowly throughout the Puget Sound, there remains a critical shortage of housing on the Eastside, with nearly all neighborhoods still considered a “seller’s market” for SFRs. Eastside condo inventory has risen enough to be entering a more balanced market. Seattle’s SFR inventory is approaching a “balanced market” and their condo market is now in “buyer’s market” territory.
As is typical, the real estate market picked up as soon as the kids went back to school and the Labor Day weekend ended. I received multiple offers on my recent listings, indicating demand is still strong. With the recent interest rate drop and the Feds expected to announce further reductions next week, demand is already up. It’s a great time to buy, despite the increased competition. For Sellers, it’s not too late to take advantage of our strong early Fall market! Let me know how I can help.
If you haven’t already, it’s time to schedule your annual furnace servicing and sprinkler winterization. Need a referral? Give me a call!
32%
OF HOMES SOLD ABOVE LIST PRICE
79%
OF HOMES SOLD WITHIN 30 DAYS OR LESS
1.2
MONTHS SUPPLY OF AVAILABLE HOMES*
Median Closed Sales Price
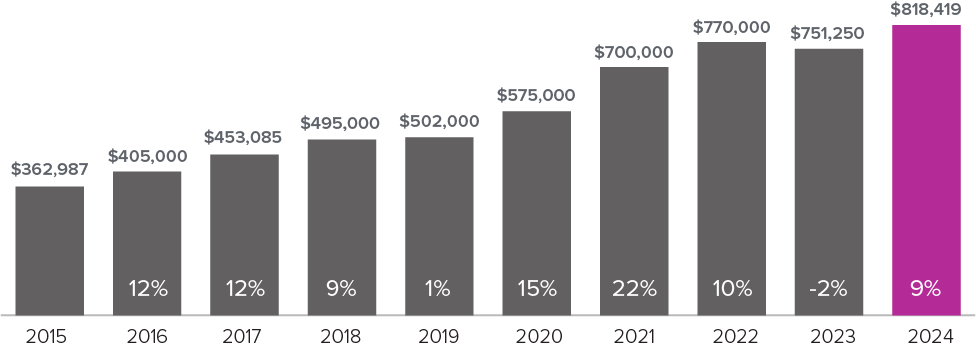
*Months supply of available homes is calculated by dividing active inventory at the end of the month by pending. Pending sales are mutual purchase agreements that haven't closed yet.
**Graphs were created using data provided by Windermere Real Estate and NWMLS, but the information was not verified or published by NWMLS. Data reflects all new and resale single-family home sales, which include townhomes and exclude condos, for the month of August 2024.
August played out as I expected with the slower market reflected in a 4.3% reduction in the median price of a Single Family Residence (SFR) in both Seattle and the Eastside. The number of homes selling at or above list price also decreased a little in both areas and the length of time on market increased. While inventory is rising slowly throughout the Puget Sound, there remains a critical shortage of housing on the Eastside, with nearly all neighborhoods still considered a “seller’s market” for SFRs. Eastside condo inventory has risen enough to be entering a more balanced market. Seattle’s SFR inventory is approaching a “balanced market” and their condo market is now in “buyer’s market” territory.
As is typical, the real estate market picked up as soon as the kids went back to school and the Labor Day weekend ended. I received multiple offers on my recent listings, indicating demand is still strong. With the recent interest rate drop and the Feds expected to announce further reductions next week, demand is already up. It’s a great time to buy, despite the increased competition. For Sellers, it’s not too late to take advantage of our strong early Fall market! Let me know how I can help.
If you haven’t already, it’s time to schedule your annual furnace servicing and sprinkler winterization. Need a referral? Give me a call!
39%
OF HOMES SOLD ABOVE LIST PRICE
82%
OF HOMES SOLD WITHIN 30 DAYS OR LESS
1.4
MONTHS SUPPLY OF AVAILABLE HOMES*
Median Closed Sales Price

*Months supply of available homes is calculated by dividing active inventory at the end of the month by pending. Pending sales are mutual purchase agreements that haven't closed yet.
**Graphs were created using data provided by Windermere Real Estate and NWMLS, but the information was not verified or published by NWMLS. Data reflects all new and resale single-family home sales, which include townhomes and exclude condos, for the month of August 2024.
31%
OF HOMES SOLD ABOVE LIST PRICE
78%
OF HOMES SOLD WITHIN 30 DAYS OR LESS
2.0
MONTHS SUPPLY OF AVAILABLE HOMES*
Median Closed Sales Price

*Months supply of available homes is calculated by dividing active inventory at the end of the month by pending. Pending sales are mutual purchase agreements that haven't closed yet.
**Graphs were created using data provided by Windermere Real Estate and NWMLS, but the information was not verified or published by NWMLS. Data reflects all new and resale single-family home sales, which include townhomes and exclude condos, for the month of August 2024.
August played out as I expected with the slower market reflected in a 4.3% reduction in the median price of a Single Family Residence (SFR) in both Seattle and the Eastside. The number of homes selling at or above list price also decreased a little in both areas and the length of time on market increased. While inventory is rising slowly throughout the Puget Sound, there remains a critical shortage of housing on the Eastside, with nearly all neighborhoods still considered a “seller’s market” for SFRs. Eastside condo inventory has risen enough to be entering a more balanced market. Seattle’s SFR inventory is approaching a “balanced market” and their condo market is now in “buyer’s market” territory.
As is typical, the real estate market picked up as soon as the kids went back to school and the Labor Day weekend ended. I received multiple offers on my recent listings, indicating demand is still strong. With the recent interest rate drop and the Feds expected to announce further reductions next week, demand is already up. It’s a great time to buy, despite the increased competition. For Sellers, it’s not too late to take advantage of our strong early Fall market! Let me know how I can help.
If you haven’t already, it’s time to schedule your annual furnace servicing and sprinkler winterization. Need a referral? Give me a call!
32%
OF HOMES SOLD ABOVE LIST PRICE
79%
OF HOMES SOLD WITHIN 30 DAYS OR LESS
1.2
MONTHS SUPPLY OF AVAILABLE HOMES*
Median Closed Sales Price

*Months supply of available homes is calculated by dividing active inventory at the end of the month by pending. Pending sales are mutual purchase agreements that haven't closed yet.
**Graphs were created using data provided by Windermere Real Estate and NWMLS, but the information was not verified or published by NWMLS. Data reflects all new and resale single-family home sales, which include townhomes and exclude condos, for the month of August 2024.
August played out as I expected with the slower market reflected in a 4.3% reduction in the median price of a Single Family Residence (SFR) in both Seattle and the Eastside. The number of homes selling at or above list price also decreased a little in both areas and the length of time on market increased. While inventory is rising slowly throughout the Puget Sound, there remains a critical shortage of housing on the Eastside, with nearly all neighborhoods still considered a “seller’s market” for SFRs. Eastside condo inventory has risen enough to be entering a more balanced market. Seattle’s SFR inventory is approaching a “balanced market” and their condo market is now in “buyer’s market” territory.
As is typical, the real estate market picked up as soon as the kids went back to school and the Labor Day weekend ended. I received multiple offers on my recent listings, indicating demand is still strong. With the recent interest rate drop and the Feds expected to announce further reductions next week, demand is already up. It’s a great time to buy, despite the increased competition. For Sellers, it’s not too late to take advantage of our strong early Fall market! Let me know how I can help.
If you haven’t already, it’s time to schedule your annual furnace servicing and sprinkler winterization. Need a referral? Give me a call!
43%
OF HOMES SOLD ABOVE LIST PRICE
87%
OF HOMES SOLD WITHIN 30 DAYS OR LESS
1.2
MONTHS SUPPLY OF AVAILABLE HOMES*
Median Closed Sales Price
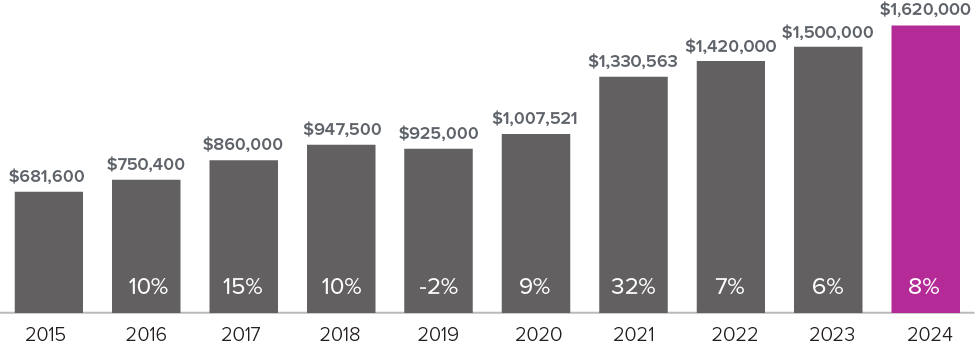
*Months supply of available homes is calculated by dividing active inventory at the end of the month by pending. Pending sales are mutual purchase agreements that haven't closed yet.
**Graphs were created using data provided by Windermere Real Estate and NWMLS, but the information was not verified or published by NWMLS. Data reflects all new and resale single-family home sales, which include townhomes and exclude condos, for the month of July 2024.
There were no major changes, statistically, in our local real estate market from June to July. On the Eastside, both Single Family Residence (SFR) and condo median prices dipped slightly. This was expected as inventory typically goes up and buyer activity slows in summer. However, despite the same seasonal situation in Seattle, the median prices of SFRs and condos both increased 1.6% in July. Though not a large difference, it’s particularly surprising for Seattle condos which now have 4 months of inventory, indicating a “buyer’s market” is forming. I believe Seattle’s median price increases are an anomaly and I expect that we will see an adjustment next month.
The big news in real estate this month is the recent decrease in interest rates! We reached a 15-month low based on expectations that the Fed will decrease rates when they meet in September. This has created great opportunities for buyers to take advantage of better rates AND more inventory to choose from before the market heats up again. Waiting for further interest rate drops is a gamble, but it’s certain that if they continue to improve more buyers will enter the market and competition will increase. Now is also an excellent time for those considering purchasing a second home to start searching as that market tends to have more inventory. (If you’re buying out of the area, I can refer you to an excellent colleague to help with your search.)
Our real estate market typically picks up in early Fall as vacations end and school starts. I encourage sellers looking to take advantage of that market to get in touch now to discuss how to maximize their efforts. As always, I’m happy to help!
34%
OF HOMES SOLD ABOVE LIST PRICE
82%
OF HOMES SOLD WITHIN 30 DAYS OR LESS
2.0
MONTHS SUPPLY OF AVAILABLE HOMES*
Median Closed Sales Price
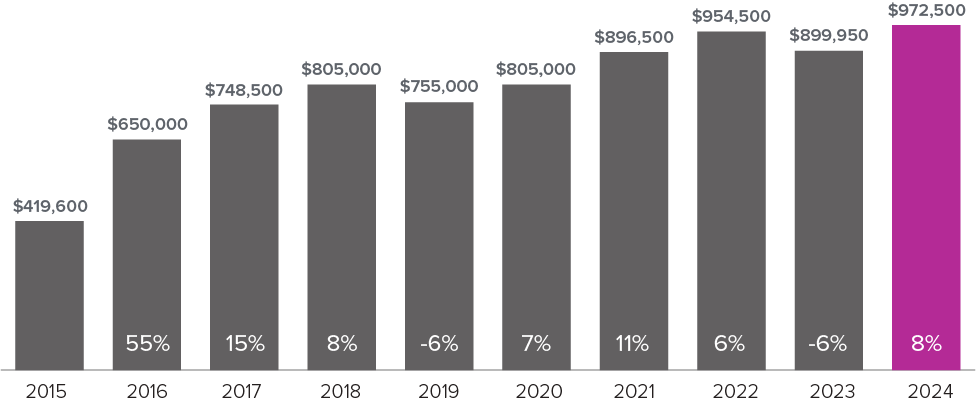
*Months supply of available homes is calculated by dividing active inventory at the end of the month by pending. Pending sales are mutual purchase agreements that haven't closed yet.
**Graphs were created using data provided by Windermere Real Estate and NWMLS, but the information was not verified or published by NWMLS. Data reflects all new and resale single-family home sales, which include townhomes and exclude condos, for the month of July 2024.
There were no major changes, statistically, in our local real estate market from June to July. On the Eastside, both Single Family Residence (SFR) and condo median prices dipped slightly. This was expected as inventory typically goes up and buyer activity slows in summer. However, despite the same seasonal situation in Seattle, the median prices of SFRs and condos both increased 1.6% in July. Though not a large difference, it’s particularly surprising for Seattle condos which now have 4 months of inventory, indicating a “buyer’s market” is forming. I believe Seattle’s median price increases are an anomaly and I expect that we will see an adjustment next month.
The big news in real estate this month is the recent decrease in interest rates! We reached a 15-month low based on expectations that the Fed will decrease rates when they meet in September. This has created great opportunities for buyers to take advantage of better rates AND more inventory to choose from before the market heats up again. Waiting for further interest rate drops is a gamble, but it’s certain that if they continue to improve more buyers will enter the market and competition will increase. Now is also an excellent time for those considering purchasing a second home to start searching as that market tends to have more inventory. (If you’re buying out of the area, I can refer you to an excellent colleague to help with your search.)
Our real estate market typically picks up in early Fall as vacations end and school starts. I encourage sellers looking to take advantage of that market to get in touch now to discuss how to maximize their efforts. As always, I’m happy to help!
35%
OF HOMES SOLD ABOVE LIST PRICE
83%
OF HOMES SOLD WITHIN 30 DAYS OR LESS
1.3
MONTHS SUPPLY OF AVAILABLE HOMES*
Median Closed Sales Price

*Months supply of available homes is calculated by dividing active inventory at the end of the month by pending. Pending sales are mutual purchase agreements that haven't closed yet.
**Graphs were created using data provided by Windermere Real Estate and NWMLS, but the information was not verified or published by NWMLS. Data reflects all new and resale single-family home sales, which include townhomes and exclude condos, for the month of July 2024.
There were no major changes, statistically, in our local real estate market from June to July. On the Eastside, both Single Family Residence (SFR) and condo median prices dipped slightly. This was expected as inventory typically goes up and buyer activity slows in summer. However, despite the same seasonal situation in Seattle, the median prices of SFRs and condos both increased 1.6% in July. Though not a large difference, it’s particularly surprising for Seattle condos which now have 4 months of inventory, indicating a “buyer’s market” is forming. I believe Seattle’s median price increases are an anomaly and I expect that we will see an adjustment next month.
The big news in real estate this month is the recent decrease in interest rates! We reached a 15-month low based on expectations that the Fed will decrease rates when they meet in September. This has created great opportunities for buyers to take advantage of better rates AND more inventory to choose from before the market heats up again. Waiting for further interest rate drops is a gamble, but it’s certain that if they continue to improve more buyers will enter the market and competition will increase. Now is also an excellent time for those considering purchasing a second home to start searching as that market tends to have more inventory. (If you’re buying out of the area, I can refer you to an excellent colleague to help with your search.)
Our real estate market typically picks up in early Fall as vacations end and school starts. I encourage sellers looking to take advantage of that market to get in touch now to discuss how to maximize their efforts. As always, I’m happy to help!
43%
OF HOMES SOLD ABOVE LIST PRICE
87%
OF HOMES SOLD WITHIN 30 DAYS OR LESS
1.2
MONTHS SUPPLY OF AVAILABLE HOMES*
Median Closed Sales Price

*Months supply of available homes is calculated by dividing active inventory at the end of the month by pending. Pending sales are mutual purchase agreements that haven't closed yet.
**Graphs were created using data provided by Windermere Real Estate and NWMLS, but the information was not verified or published by NWMLS. Data reflects all new and resale single-family home sales, which include townhomes and exclude condos, for the month of July 2024.
There were no major changes, statistically, in our local real estate market from June to July. On the Eastside, both Single Family Residence (SFR) and condo median prices dipped slightly. This was expected as inventory typically goes up and buyer activity slows in summer. However, despite the same seasonal situation in Seattle, the median prices of SFRs and condos both increased 1.6% in July. Though not a large difference, it’s particularly surprising for Seattle condos which now have 4 months of inventory, indicating a “buyer’s market” is forming. I believe Seattle’s median price increases are an anomaly and I expect that we will see an adjustment next month.
The big news in real estate this month is the recent decrease in interest rates! We reached a 15-month low based on expectations that the Fed will decrease rates when they meet in September. This has created great opportunities for buyers to take advantage of better rates AND more inventory to choose from before the market heats up again. Waiting for further interest rate drops is a gamble, but it’s certain that if they continue to improve more buyers will enter the market and competition will increase. Now is also an excellent time for those considering purchasing a second home to start searching as that market tends to have more inventory. (If you’re buying out of the area, I can refer you to an excellent colleague to help with your search.)
Our real estate market typically picks up in early Fall as vacations end and school starts. I encourage sellers looking to take advantage of that market to get in touch now to discuss how to maximize their efforts. As always, I’m happy to help!
34%
OF HOMES SOLD ABOVE LIST PRICE
82%
OF HOMES SOLD WITHIN 30 DAYS OR LESS
2.0
MONTHS SUPPLY OF AVAILABLE HOMES*
Median Closed Sales Price

*Months supply of available homes is calculated by dividing active inventory at the end of the month by pending. Pending sales are mutual purchase agreements that haven't closed yet.
**Graphs were created using data provided by Windermere Real Estate and NWMLS, but the information was not verified or published by NWMLS. Data reflects all new and resale single-family home sales, which include townhomes and exclude condos, for the month of July 2024.
There were no major changes, statistically, in our local real estate market from June to July. On the Eastside, both Single Family Residence (SFR) and condo median prices dipped slightly. This was expected as inventory typically goes up and buyer activity slows in summer. However, despite the same seasonal situation in Seattle, the median prices of SFRs and condos both increased 1.6% in July. Though not a large difference, it’s particularly surprising for Seattle condos which now have 4 months of inventory, indicating a “buyer’s market” is forming. I believe Seattle’s median price increases are an anomaly and I expect that we will see an adjustment next month.
The big news in real estate this month is the recent decrease in interest rates! We reached a 15-month low based on expectations that the Fed will decrease rates when they meet in September. This has created great opportunities for buyers to take advantage of better rates AND more inventory to choose from before the market heats up again. Waiting for further interest rate drops is a gamble, but it’s certain that if they continue to improve more buyers will enter the market and competition will increase. Now is also an excellent time for those considering purchasing a second home to start searching as that market tends to have more inventory. (If you’re buying out of the area, I can refer you to an excellent colleague to help with your search.)
Our real estate market typically picks up in early Fall as vacations end and school starts. I encourage sellers looking to take advantage of that market to get in touch now to discuss how to maximize their efforts. As always, I’m happy to help!
35%
OF HOMES SOLD ABOVE LIST PRICE
83%
OF HOMES SOLD WITHIN 30 DAYS OR LESS
1.3
MONTHS SUPPLY OF AVAILABLE HOMES*
Median Closed Sales Price

*Months supply of available homes is calculated by dividing active inventory at the end of the month by pending. Pending sales are mutual purchase agreements that haven't closed yet.
**Graphs were created using data provided by Windermere Real Estate and NWMLS, but the information was not verified or published by NWMLS. Data reflects all new and resale single-family home sales, which include townhomes and exclude condos, for the month of July 2024.
There were no major changes, statistically, in our local real estate market from June to July. On the Eastside, both Single Family Residence (SFR) and condo median prices dipped slightly. This was expected as inventory typically goes up and buyer activity slows in summer. However, despite the same seasonal situation in Seattle, the median prices of SFRs and condos both increased 1.6% in July. Though not a large difference, it’s particularly surprising for Seattle condos which now have 4 months of inventory, indicating a “buyer’s market” is forming. I believe Seattle’s median price increases are an anomaly and I expect that we will see an adjustment next month.
The big news in real estate this month is the recent decrease in interest rates! We reached a 15-month low based on expectations that the Fed will decrease rates when they meet in September. This has created great opportunities for buyers to take advantage of better rates AND more inventory to choose from before the market heats up again. Waiting for further interest rate drops is a gamble, but it’s certain that if they continue to improve more buyers will enter the market and competition will increase. Now is also an excellent time for those considering purchasing a second home to start searching as that market tends to have more inventory. (If you’re buying out of the area, I can refer you to an excellent colleague to help with your search.)
Our real estate market typically picks up in early Fall as vacations end and school starts. I encourage sellers looking to take advantage of that market to get in touch now to discuss how to maximize their efforts. As always, I’m happy to help!
50%
OF HOMES SOLD ABOVE LIST PRICE
90%
OF HOMES SOLD WITHIN 30 DAYS OR LESS
1.2
MONTHS SUPPLY OF AVAILABLE HOMES*
Median Closed Sales Price
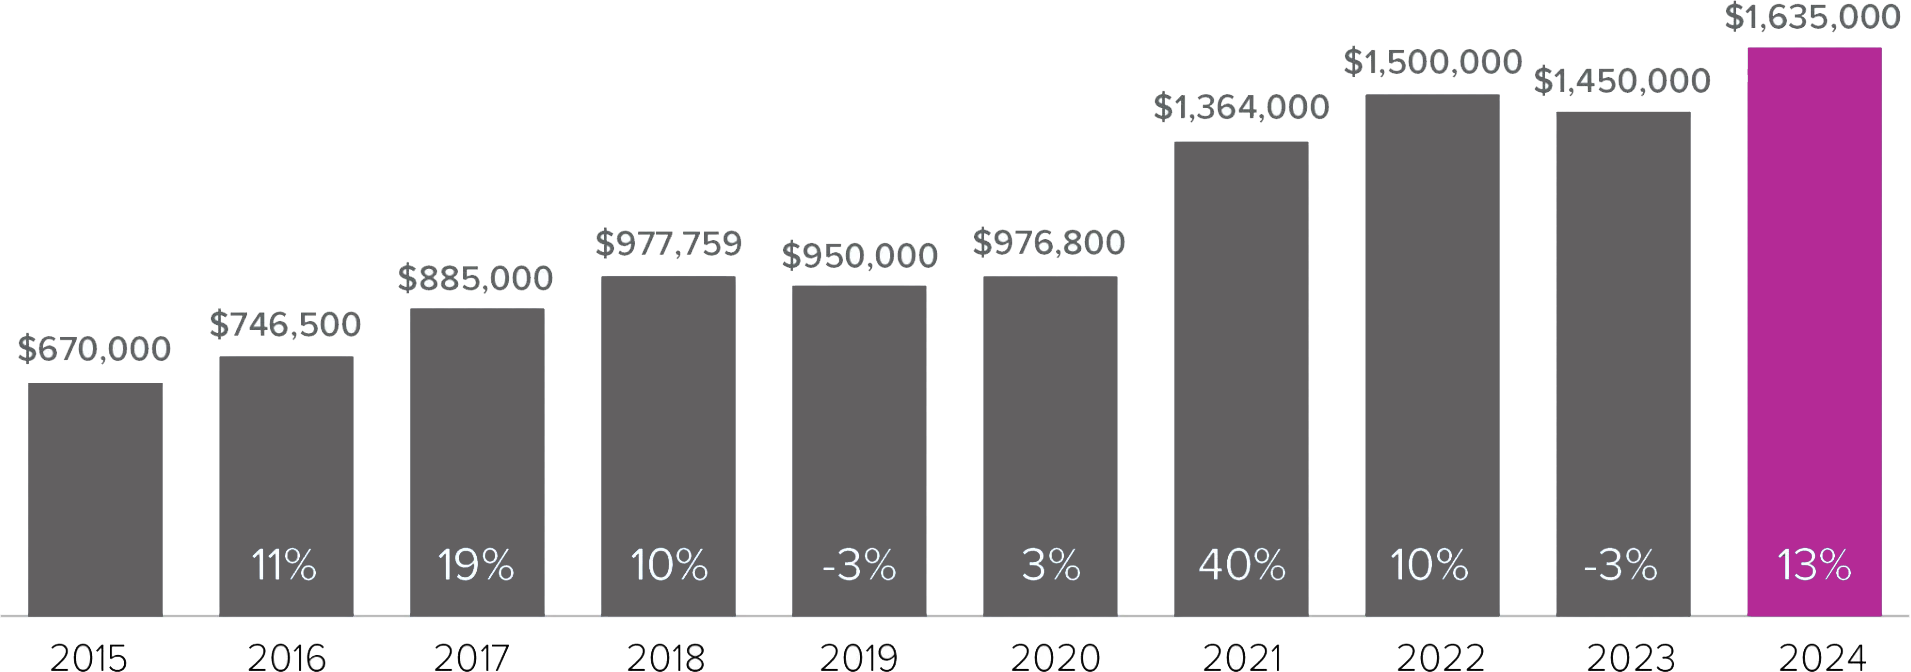
*Months supply of available homes is calculated by dividing active inventory at the end of the month by pending. Pending sales are mutual purchase agreements that haven't closed yet.
**Graphs were created using data provided by Windermere Real Estate and NWMLS, but the information was not verified or published by NWMLS. Data reflects all new and resale single-family home sales, which include townhomes and exclude condos, for the month of June 2024.
June’s Eastside Single Family Residence (SFR) stats reflect the expected summer slowdown due to increasing inventory and decreased buyer activity. The SFR median price went down around 4% to $1,635,000 and market times are starting to lengthen. In Seattle, the SFR median price decreased slightly to $957,000 and there was a small increase in market times. As Seattle tends to lag the Eastside, I expect this trend to accelerate in the next couple of months.
The condo market in both areas is experiencing more marked change. On the Eastside, the median cost of a condo decreased $111,000 (15%) to $637,500. That is a more significant change than would be accounted for by our typical seasonal slowdown. Since condo demand still exceeds supply on the Eastside, it remains to be seen if it’s a one-off occurrence or the beginning of a trend. As anticipated, the notable increase in Seattle condo listings has created a “buyer’s market” wherein inventory now exceeds supply. The median cost decreased $50,000 to $550,000 and I expect this trend to continue.
Interest rates and buyer competition both dropped in June, but inventory is up, making it an excellent time to buy! If you or someone you know is looking, I’d love to help. For SFR sellers, demand still outstrips supply so while it may take longer to sell your home, if it is well-prepared and expertly marketed, the market is still strong. If you’re planning to wait for the more robust early-Fall market, now is the time to prepare your home. I’d be happy to help you determine how best to prioritize your pre-listing tasks.
39%
OF HOMES SOLD ABOVE LIST PRICE
88%
OF HOMES SOLD WITHIN 30 DAYS OR LESS
1.7
MONTHS SUPPLY OF AVAILABLE HOMES*
Median Closed Sales Price
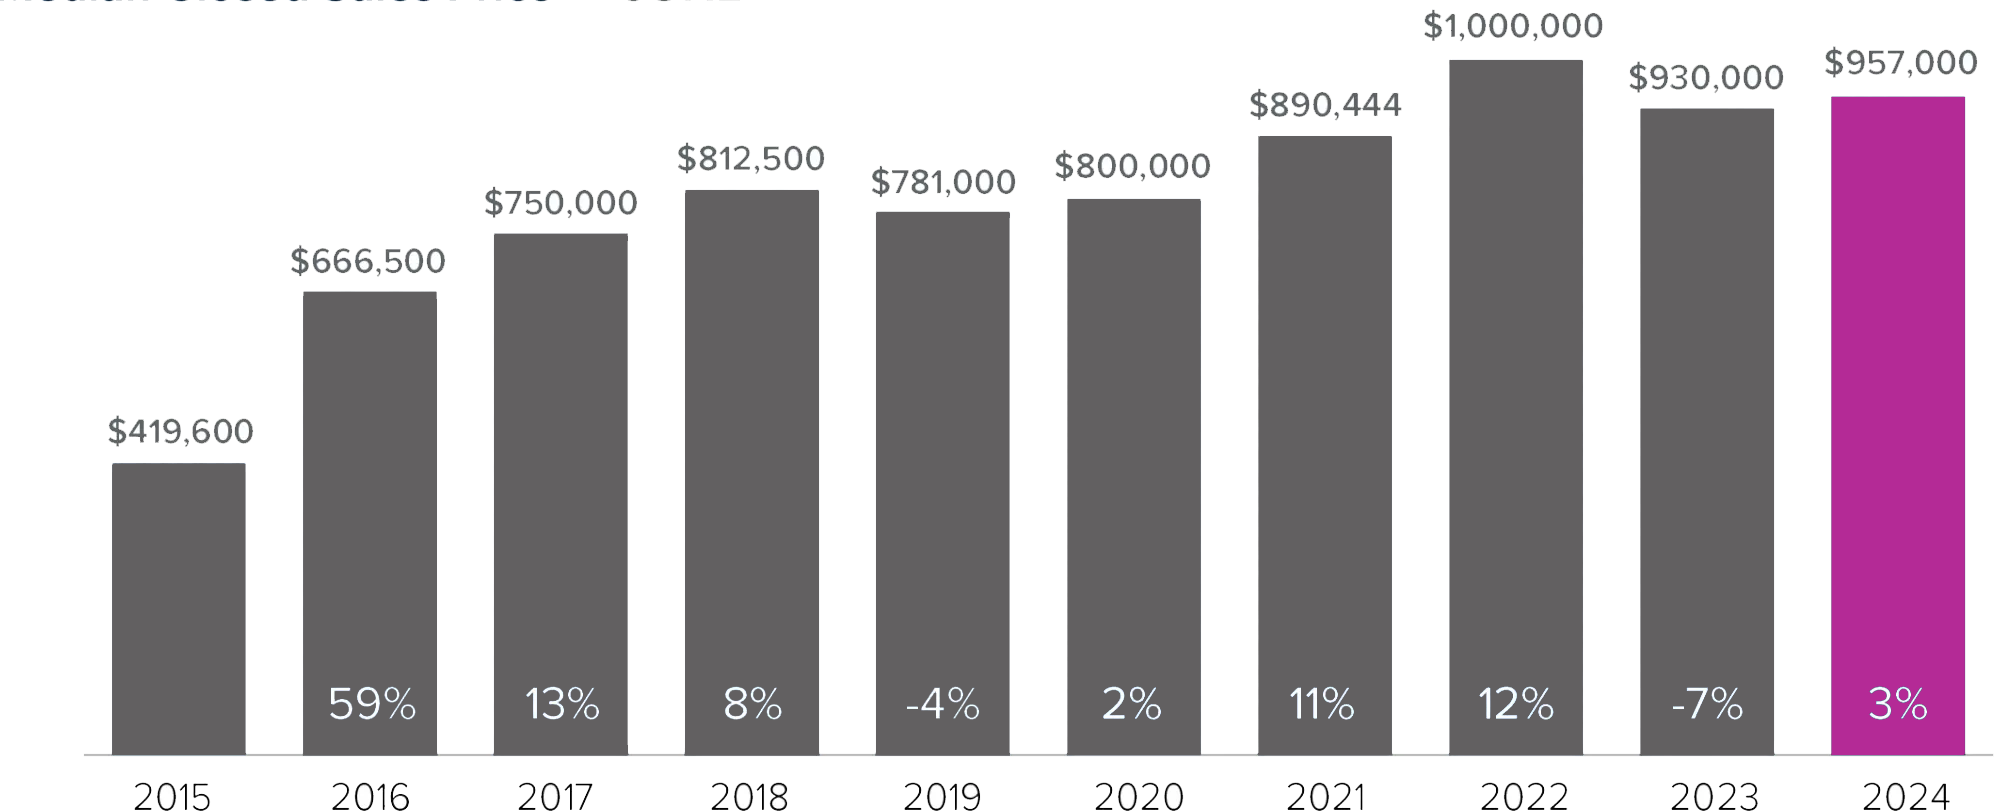
*Months supply of available homes is calculated by dividing active inventory at the end of the month by pending. Pending sales are mutual purchase agreements that haven't closed yet.
**Graphs were created using data provided by Windermere Real Estate and NWMLS, but the information was not verified or published by NWMLS. Data reflects all new and resale single-family home sales, which include townhomes and exclude condos, for the month of June 2024.
June’s Eastside Single Family Residence (SFR) stats reflect the expected summer slowdown due to increasing inventory and decreased buyer activity. The SFR median price went down around 4% to $1,635,000 and market times are starting to lengthen. In Seattle, the SFR median price decreased slightly to $957,000 and there was a small increase in market times. As Seattle tends to lag the Eastside, I expect this trend to accelerate in the next couple of months.
The condo market in both areas is experiencing more marked change. On the Eastside, the median cost of a condo decreased $111,000 (15%) to $637,500. That is a more significant change than would be accounted for by our typical seasonal slowdown. Since condo demand still exceeds supply on the Eastside, it remains to be seen if it’s a one-off occurrence or the beginning of a trend. As anticipated, the notable increase in Seattle condo listings has created a “buyer’s market” wherein inventory now exceeds supply. The median cost decreased $50,000 to $550,000 and I expect this trend to continue.
Interest rates and buyer competition both dropped in June, but inventory is up, making it an excellent time to buy! If you or someone you know is looking, I’d love to help. For SFR sellers, demand still outstrips supply so while it may take longer to sell your home, if it is well-prepared and expertly marketed, the market is still strong. If you’re planning to wait for the more robust early-Fall market, now is the time to prepare your home. I’d be happy to help you determine how best to prioritize your pre-listing tasks.
44%
OF HOMES SOLD ABOVE LIST PRICE
91%
OF HOMES SOLD WITHIN 30 DAYS OR LESS
1.3
MONTHS SUPPLY OF AVAILABLE HOMES*
Median Closed Sales Price
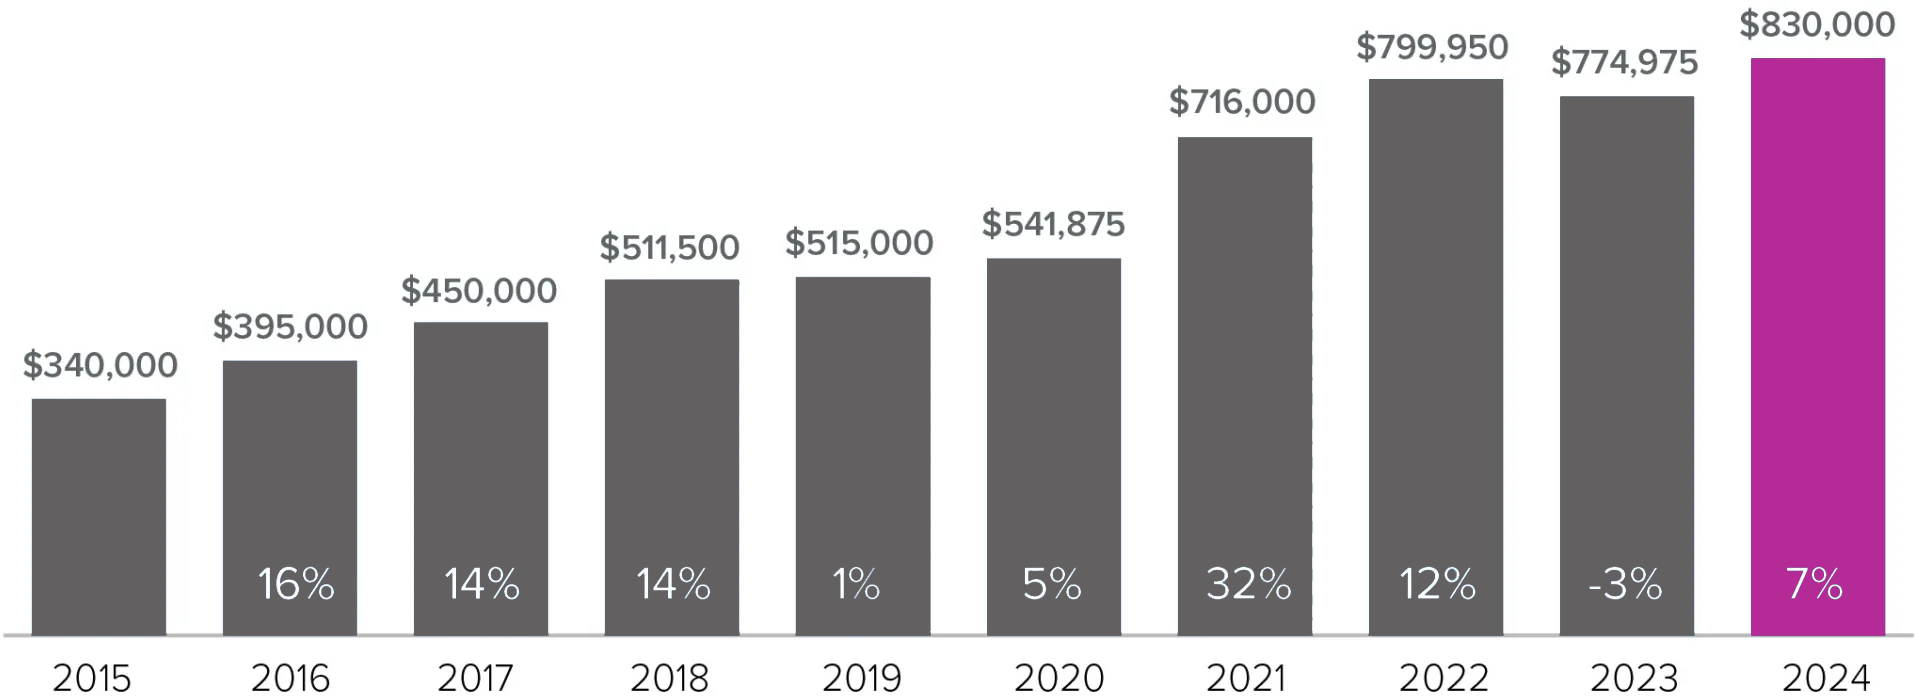
*Months supply of available homes is calculated by dividing active inventory at the end of the month by pending. Pending sales are mutual purchase agreements that haven't closed yet.
**Graphs were created using data provided by Windermere Real Estate and NWMLS, but the information was not verified or published by NWMLS. Data reflects all new and resale single-family home sales, which include townhomes and exclude condos, for the month of June 2024.
June’s Eastside Single Family Residence (SFR) stats reflect the expected summer slowdown due to increasing inventory and decreased buyer activity. The SFR median price went down around 4% to $1,635,000 and market times are starting to lengthen. In Seattle, the SFR median price decreased slightly to $957,000 and there was a small increase in market times. As Seattle tends to lag the Eastside, I expect this trend to accelerate in the next couple of months.
The condo market in both areas is experiencing more marked change. On the Eastside, the median cost of a condo decreased $111,000 (15%) to $637,500. That is a more significant change than would be accounted for by our typical seasonal slowdown. Since condo demand still exceeds supply on the Eastside, it remains to be seen if it’s a one-off occurrence or the beginning of a trend. As anticipated, the notable increase in Seattle condo listings has created a “buyer’s market” wherein inventory now exceeds supply. The median cost decreased $50,000 to $550,000 and I expect this trend to continue.
Interest rates and buyer competition both dropped in June, but inventory is up, making it an excellent time to buy! If you or someone you know is looking, I’d love to help. For SFR sellers, demand still outstrips supply so while it may take longer to sell your home, if it is well-prepared and expertly marketed, the market is still strong. If you’re planning to wait for the more robust early-Fall market, now is the time to prepare your home. I’d be happy to help you determine how best to prioritize your pre-listing tasks.
43%
OF HOMES SOLD ABOVE LIST PRICE
87%
OF HOMES SOLD WITHIN 30 DAYS OR LESS
1.2
MONTHS SUPPLY OF AVAILABLE HOMES*
Median Closed Sales Price

*Months supply of available homes is calculated by dividing active inventory at the end of the month by pending. Pending sales are mutual purchase agreements that haven't closed yet.
**Graphs were created using data provided by Windermere Real Estate and NWMLS, but the information was not verified or published by NWMLS. Data reflects all new and resale single-family home sales, which include townhomes and exclude condos, for the month of July 2024.
There were no major changes, statistically, in our local real estate market from June to July. On the Eastside, both Single Family Residence (SFR) and condo median prices dipped slightly. This was expected as inventory typically goes up and buyer activity slows in summer. However, despite the same seasonal situation in Seattle, the median prices of SFRs and condos both increased 1.6% in July. Though not a large difference, it’s particularly surprising for Seattle condos which now have 4 months of inventory, indicating a “buyer’s market” is forming. I believe Seattle’s median price increases are an anomaly and I expect that we will see an adjustment next month.
The big news in real estate this month is the recent decrease in interest rates! We reached a 15-month low based on expectations that the Fed will decrease rates when they meet in September. This has created great opportunities for buyers to take advantage of better rates AND more inventory to choose from before the market heats up again. Waiting for further interest rate drops is a gamble, but it’s certain that if they continue to improve more buyers will enter the market and competition will increase. Now is also an excellent time for those considering purchasing a second home to start searching as that market tends to have more inventory. (If you’re buying out of the area, I can refer you to an excellent colleague to help with your search.)
Our real estate market typically picks up in early Fall as vacations end and school starts. I encourage sellers looking to take advantage of that market to get in touch now to discuss how to maximize their efforts. As always, I’m happy to help!
34%
OF HOMES SOLD ABOVE LIST PRICE
82%
OF HOMES SOLD WITHIN 30 DAYS OR LESS
2.0
MONTHS SUPPLY OF AVAILABLE HOMES*
Median Closed Sales Price

*Months supply of available homes is calculated by dividing active inventory at the end of the month by pending. Pending sales are mutual purchase agreements that haven't closed yet.
**Graphs were created using data provided by Windermere Real Estate and NWMLS, but the information was not verified or published by NWMLS. Data reflects all new and resale single-family home sales, which include townhomes and exclude condos, for the month of July 2024.
There were no major changes, statistically, in our local real estate market from June to July. On the Eastside, both Single Family Residence (SFR) and condo median prices dipped slightly. This was expected as inventory typically goes up and buyer activity slows in summer. However, despite the same seasonal situation in Seattle, the median prices of SFRs and condos both increased 1.6% in July. Though not a large difference, it’s particularly surprising for Seattle condos which now have 4 months of inventory, indicating a “buyer’s market” is forming. I believe Seattle’s median price increases are an anomaly and I expect that we will see an adjustment next month.
The big news in real estate this month is the recent decrease in interest rates! We reached a 15-month low based on expectations that the Fed will decrease rates when they meet in September. This has created great opportunities for buyers to take advantage of better rates AND more inventory to choose from before the market heats up again. Waiting for further interest rate drops is a gamble, but it’s certain that if they continue to improve more buyers will enter the market and competition will increase. Now is also an excellent time for those considering purchasing a second home to start searching as that market tends to have more inventory. (If you’re buying out of the area, I can refer you to an excellent colleague to help with your search.)
Our real estate market typically picks up in early Fall as vacations end and school starts. I encourage sellers looking to take advantage of that market to get in touch now to discuss how to maximize their efforts. As always, I’m happy to help!
35%
OF HOMES SOLD ABOVE LIST PRICE
83%
OF HOMES SOLD WITHIN 30 DAYS OR LESS
1.3
MONTHS SUPPLY OF AVAILABLE HOMES*
Median Closed Sales Price

*Months supply of available homes is calculated by dividing active inventory at the end of the month by pending. Pending sales are mutual purchase agreements that haven't closed yet.
**Graphs were created using data provided by Windermere Real Estate and NWMLS, but the information was not verified or published by NWMLS. Data reflects all new and resale single-family home sales, which include townhomes and exclude condos, for the month of July 2024.
There were no major changes, statistically, in our local real estate market from June to July. On the Eastside, both Single Family Residence (SFR) and condo median prices dipped slightly. This was expected as inventory typically goes up and buyer activity slows in summer. However, despite the same seasonal situation in Seattle, the median prices of SFRs and condos both increased 1.6% in July. Though not a large difference, it’s particularly surprising for Seattle condos which now have 4 months of inventory, indicating a “buyer’s market” is forming. I believe Seattle’s median price increases are an anomaly and I expect that we will see an adjustment next month.
The big news in real estate this month is the recent decrease in interest rates! We reached a 15-month low based on expectations that the Fed will decrease rates when they meet in September. This has created great opportunities for buyers to take advantage of better rates AND more inventory to choose from before the market heats up again. Waiting for further interest rate drops is a gamble, but it’s certain that if they continue to improve more buyers will enter the market and competition will increase. Now is also an excellent time for those considering purchasing a second home to start searching as that market tends to have more inventory. (If you’re buying out of the area, I can refer you to an excellent colleague to help with your search.)
Our real estate market typically picks up in early Fall as vacations end and school starts. I encourage sellers looking to take advantage of that market to get in touch now to discuss how to maximize their efforts. As always, I’m happy to help!


Stay up to date on our local real estate market and discover fun events with my monthly newsletter delivered right to your inbox!


Terms of Use | Privacy Policy | Fair Housing Notice
Windermere Real Estate, East Inc. | © Copyright 2024 Windermere Real Estate
Site by Sweet Plum Creative


