 Facebook
 X
X
 Pinterest
 Copy Link
Local Market Update – July 2019
The market in our region appears to be moderating. Inventory is up, prices are relatively stable and homes are taking a bit longer to sell. However, with less than two months of available inventory, supply is still far short of demand. Steady buyer activity, low interest rates and a thriving economy are making for a strong summer in the housing market.
Eastside

>>>Click image to view full report.
The median price of a single-family home on the Eastside was $950,000 in June, down 3% from the same time last year and up $21,000 from May. Many buyers are looking to take advantage of the Eastside jobs boom with Amazon announcing plans to build a 43-story tower in Bellevue and Google expecting to reach 1 million square feet of office space in Kirkland.
King County

>>>Click image to view full report.
There was good news for buyers in June as a growing supply of homes helped boost inventory close to 2012 listing levels. The median price of a single-family home in King County was $695,000. That figure is a 3% drop from a year ago and virtually unchanged from May. 33% of homes sold above list price; another sign prices are moderating when compared to 52% of homes sold over list price this time last year.
Seattle

>>>Click image to view full report.
Home inventory in Seattle inched slightly higher in June. However, with less than two months of supply, the city is still a solid seller’s market. Apple’s plan to turn Seattle into a key engineering hub can only add to demand. The median price of a single-family home in Seattle was $781,000, down 4% from a year ago and nearly unchanged from May.
Snohomish County

>>>Click image to view full report.
After hovering around $500,000 since March, home prices in Snohomish County crept up in June. The median price of a single-family home was $515,500, as compared to $511,500 last June. Snohomish County continues to attract buyers priced out of the King County market, putting an additional strain on supply which stands a just 1.5 months of inventory.
This post originally appeared on GetTheWreport.com
To Buy New or Old, That is the Question
We are often asked, “Which is the better buy, a newer or older home?” Our answer: It all depends on your needs and personal preferences. We decided to put together a list of the six biggest differences between newer and older homes:
The neighborhood
Surprisingly, one of the biggest factors in choosing a new home isn’t the property itself, but rather the surrounding neighborhood. While new homes occasionally spring up in established communities, most are built in new developments. The settings are quite different, each with their own unique benefits.
Older neighborhoods often feature tree-lined streets; larger property lots; a wide array of architectural styles; easy walking access to mass transportation, restaurants and local shops; and more established relationships among neighbors.
New developments are better known for wider streets and quiet cul-de-sacs; controlled development; fewer aboveground utilities; more parks; and often newer public facilities (schools, libraries, pools, etc.). There are typically more children in newer communities, as well.
Consider your daily work commute, too. While not always true, older neighborhoods tend to be closer to major employment centers, mass transportation and multiple car routes (neighborhood arterials, highways and freeways).
Design and layout
If you like Victorian, Craftsman or Cape Cod style homes, it used to be that you would have to buy an older home from the appropriate era. But with new-home builders now offering modern takes on those classic designs, that’s no longer the case. There are even modern log homes available.
Have you given much thought to your floor plans? If you have your heart set on a family room, an entertainment kitchen, a home office and walk-in closets, you’ll likely want to buy a newer home—or plan to do some heavy remodeling of an older home. Unless they’ve already been remodeled, most older homes feature more basic layouts.
If you have a specific home-décor style in mind, you’ll want to take that into consideration, as well. Professional designers say it’s best if the style and era of your furnishings match the style and era of your house. But if you are willing to adapt, then the options are wide open.
Materials and craftsmanship
Homes built before material and labor costs spiked in the late 1950s have a reputation for higher-grade lumber and old-world craftsmanship (hardwood floors, old-growth timber supports, ornate siding, artistic molding, etc.).
However, newer homes have the benefit of modern materials and more advanced building codes (copper or polyurethane plumbing, better insulation, double-pane windows, modern electrical wiring, earthquake/ windstorm supports, etc.).
Current condition
The condition of a home for sale is always a top consideration for any buyer. However, age is a factor here, as well. For example, if the exterior of a newer home needs repainting, it’s a relatively easy task to determine the cost. But if it’s a home built before the 1970s, you have to also consider the fact that the underlying paint is most likely lead0based, and that the wood siding may have rot or other structural issues that need to be addressed before it can be recoated.
On the flip side, the mechanicals in older homes (lights, heating systems, sump pump, etc.) tend to be better built and last longer.
Outdoor space
One of the great things about older homes is that they usually come with mature tress and bushes already in place. Buyers of new homes may have to wait years for ornamental trees, fruit trees, roses, ferns, cacti and other long-term vegetation to fill in a yard, create shade, provide privacy, and develop into an inviting outdoor space. However, maybe you’re one of the many homeowners who prefer the wide-open, low-maintenance benefits of a lightly planted yard.
Car considerations
Like it or not, most of us are extremely dependent on our cars for daily transportation. And here again, you’ll find a big difference between newer and older homes. Newer homes almost always feature ample off-street parking: usually a two-care garage and a wide driveway. An older home, depending on just how old it is, may not offer a garage—and if it does, there’s often only enough space for one car. For people who don’t feel comfortable leaving their car on the street, this alone can be a determining factor.
Finalizing your decision
While the differences between older and newer homes are striking, there’s certainly no right or wrong answer. It is a matter of personal taste, and what is available in your desired area. To quickly determine which direction your taste trends, use the information above to make a list of your most desired features, then categorize those according to the type of house in which they’re most likely to be found. The results can often be telling.
If you have questions about newer versus older homes, contact your local Windermere Real Estate broker to learn more!
This post originally appeared on the Windermere.com Blog.
Local Market Update – June 2019

The pace of the housing market gained momentum in May, bringing an uptick in open house traffic and offers. A drop in interest rates and increased inventory were great incentives for buyers. Despite the increase in supply there is less than two months of inventory available – half the national average and far short of what is considered balanced. Industry experts are predicting a strong market as we segue into summer.
Eastside
>>>Click image to view full report.
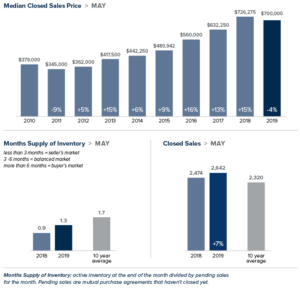
The median price of a single-family home on the Eastside was $928,800 in May, down 3% from the same time last year and virtually unchanged from April. With a booming economy that continues to grow, news of Amazon’s expansion in Bellevue, the latest Microsoft acquisition and plans for a $1.2 billion office park in Redmond, demand for housing on the Eastside is unlikely to decrease any time soon.
King County
>>>Click image to view full report.
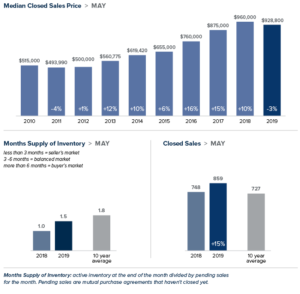
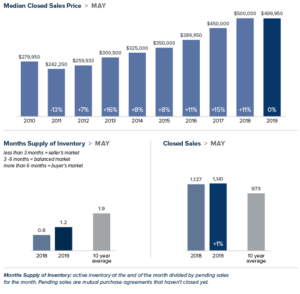
Home sale activity in King County was brisk in May. According to a Windermere analysis, 7 out of 10 properties sold last month had 15 or fewer days on the market. More than half of the homes sold at or above list price. The median price of a single-family home was $700,000. While down 4% from the same time last year, that price was up about $22,000 from the previous month. Home to the fastest growing economy in the country, King County is expected to draw even more buyers to the area this year.
Seattle
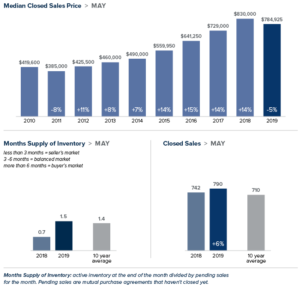
>>>Click image to view full report.
Seattle employment continues to grow faster than in most of the country. This has made the city a top location for workers, particularly millennials. Demand has put a strain on available homes, reducing the supply to just seven weeks of inventory available. May home prices in Seattle were lower than they were a year ago, but showed a healthy increase from the previous month. The median price of a single-family home was $784,925 in May, down 5% from a year ago and up $30,000 from April.
Snohomish County
>>>Click image to view full report.
In May, the median price of a single-family home in Snohomish County was $499,950. That number remains unchanged from a year ago, and also unchanged from March and April. Despite a 44% increase in inventory, the supply of homes for sale in this area is even tighter than in King County. Brokers report that buyers are being drawn from King County and willing to trade a longer work commute for more affordable housing.
This post originally appeared on GetTheWReport.com
Local Market Update – May 2019
April brought good news for homebuyers. Inventory increased, prices continued to moderate and mortgage rates remained low. While buyers have more choices, there is still less than two months of inventory on the market. Demand is expected to remain strong as we head into the prime spring real estate season.
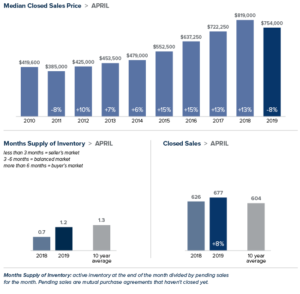
Eastside
>>>Click image to view full report.
The median price of a single-family home on the Eastside was $927,500 in April, down 2% from the same time last year. The economy here remains robust, particularly in the tech sector. After snapping up substantial real estate in Bellevue earlier this year, Amazon announced in April it would lease two more towers. Buyer demand and scarce inventory are keeping the Eastside market competitive.
King County
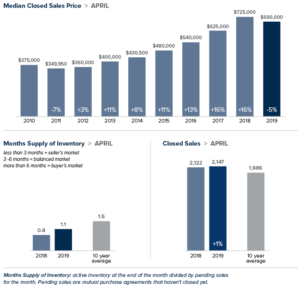
>>>Click image to view full report.
With the number of homes for sale in King County up 78% over last year, buyers have more choices and a bit more time to make a decision. However, there is still less than two months of inventory, half the national average. The median price of a single-family home in April was $690,000. That figure was down 5% from the same time last year, but up from the $677,725 median price in March.
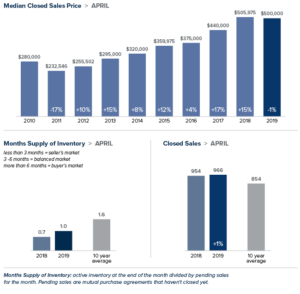
Seattle
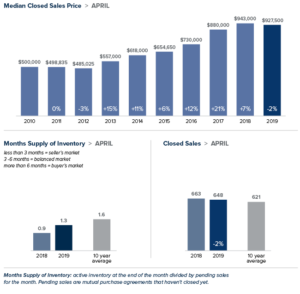
>>>Click image to view full report.
With one of the strongest economies in the nation, demand here remains solid. While the number of homes for sale continued to rise, there is just five weeks of available inventory, far short of the four to six months that is considered balanced. The median price of a single-family home in Seattle hit $754,000 in April, down 8% from a year ago and up slightly from the prior month.
Snohomish County
>>>Click image to view full report.
In Snohomish County, the median price of a single-family home fell by 1% from a year ago to $500,000, the same figure posted in March. A 57% increase in inventory combined with low interest rates have created a strong beginning to the spring market.
This post originally appeared on GetTheWReport.com
W Collection Portfolio – April 2019

Windermere Real Estate has a long tradition of genuine success — the W Collection program engages this very tradition with every detail. As a W Collection agent, I am trained to provide an extraordinary level of quality and service.
Signature marketing materials, international exposure, and dedication to perfection, ensure each W Collection property reaches the right buyers — both locally and globally. The combination of this vast global network and Windermere’s strength as the Northwest’s luxury-market leader, provides the ultimate platform to showcase truly outstanding properties or to find the dream home for the most discerning buyer.
You can find me in the W Collection Portfolio in the April issue of the Puget Sound Business Journal! This insert showcases me along with my fellow W Collection agents as well as luxury listings, market statistics and Windermere’s partnership with Luxury Portfolio International and Juwai.com.
Eastside Market Review – First Quarter 2019

Local Market Update – April 2019
After months of softening, home prices began to rise in February. That trend continued in March. While prices in most areas were down from the same time last year, they increased over the prior month. New listings rose as well, offering buyers more options and more time to make the right choice. Despite the uptick in listings, inventory is still under two months of supply, far short of the three to six months that is considered balanced.
Eastside

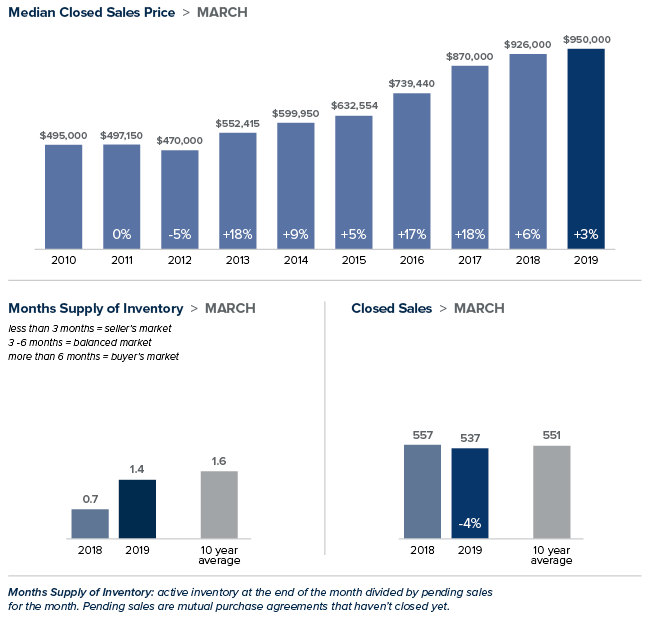
>>>Click image to view full report.
Unlike most of King County, home prices on the Eastside grew over the prior year. The median price of a single-family home on the Eastside rose 3% to $950,000. That represents an increase of $50,000 over February. Amazon’s plans to relocate its worldwide operations team to Bellevue is expected to add thousands of employees to their Eastside campus and put even more demand on what is already tight inventory.
King County
>>>Click image to view full report.
The median price of single-family home in King County in March was $667,725. That figure was down 3% from the same time last year, but up from the $655,000 median price in February. The two areas that showed price increases year-over-year were the most expensive area in the county – the Eastside – and the least expensive – Southeast King County. The number of homes for sale was more than double that of a year ago, but still far short of enough to meet demand.
Seattle
>>>Click image to view full report.
The median price of a single-family home in Seattle hit $752,500 in March, down 8% from a year ago, but up $22,500 from February. Inventory rose 136% over last year. Despite the increase, new listings that were competitively priced saw many multiple and contingency-stripped offers.
Snohomish County
>>>Click image to view full report.
In Snohomish County, the median price of a single-family home grew 5.3% over last year to $500,000. That was an increase of $25,000 over February. A new passenger terminal at Paine Field is expected to provide a boost to the local economy and also lift demand for housing.
This post originally appeared on GetTheWReport.com.
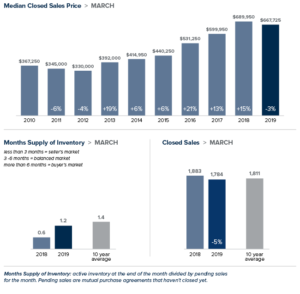
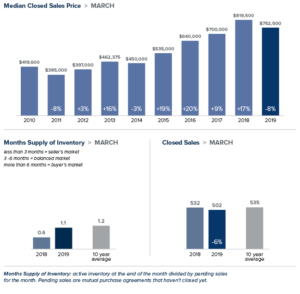
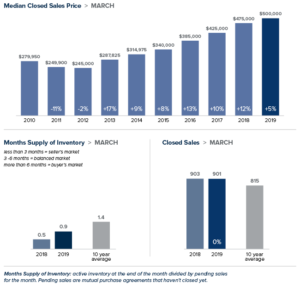
Local Market Update – March 2019
The spring home buying season started early this year. Open houses had increased attendance and bidding wars returned. After months of softening, home prices in most of the region jumped significantly from the prior month. With just one month of data, we’ll have to wait and see if this is the start of a longer upward trend.
Eastside

>>>Click image to view full report.
The Eastside was one area of King County that continued to see prices moderate. The median price of a single-family home on the Eastside was $900,000 in February, a drop of 5 percent from a year ago and down slightly from last month. However, supply here isn’t nearly enough to meet demand, a fact that most likely won’t change any time soon. Amazon’s latest expansion in Bellevue is expected to bring a significant wave of new employees to the city.
King County

>>>Click image to view full report.
The median single-family home in King County sold for $655,000 in February. While up slightly less than 1 percent year-over-year, it was an increase of $45,000 over January. Southeast King County, which includes Kent, Renton and Auburn, saw the greatest gains with prices rising 4.5 percent over the previous year. While inventory has grown, it is less than half of the four to six months that is considered balanced.
Seattle

>>>Click image to view full report.
More inventory and low interest rates helped bring buyers back into the market. The median price of a single-family home in Seattle hit $730,000 in February, down 6 percent from a year ago, but up $18,500 from January. With just six weeks of available supply, Seattle continues to have the tightest inventory in the county. Seattle’s record development boom shows little signs of easing, so we can expect strong demand to continue.
Snohomish County

>>>Click image to view full report.
The median price of a single-family home in Snohomish County reached $474,947 in February. Although that is a 2 percent decrease from last year, it is $5,000 more than January. As buyers push outside of King County to search for more reasonably priced homes, Snohomish County continues to struggle to find enough inventory to meet growing demand.
This post originally appeared on the WindermereEastside.com Blog.
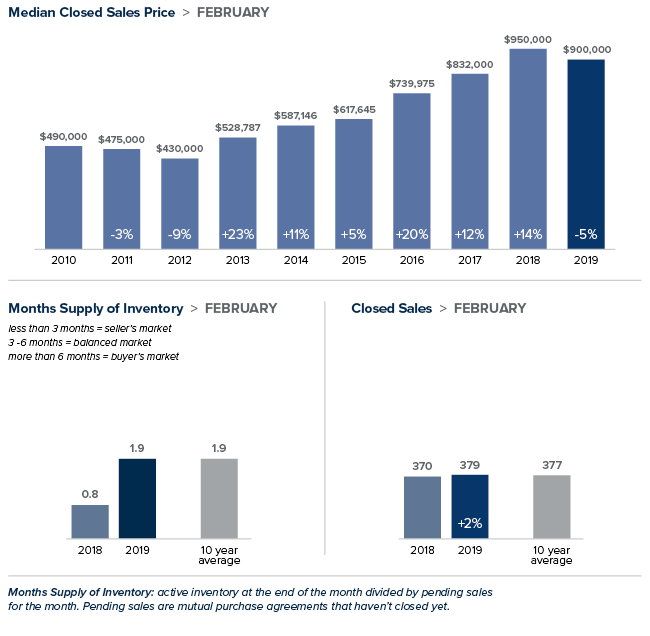
Local Market Update – February 2019
January brought more good news for homebuyers. Prices were down, inventory was up and interest rates hovered near a nine-month low. Those factors drove more buyers into the market and resulted in an uptick in sales for the month. We’ll see how this transitioning market evolves as we head into the prime Spring home buying season.
Eastside

>>>Click image to view full report.
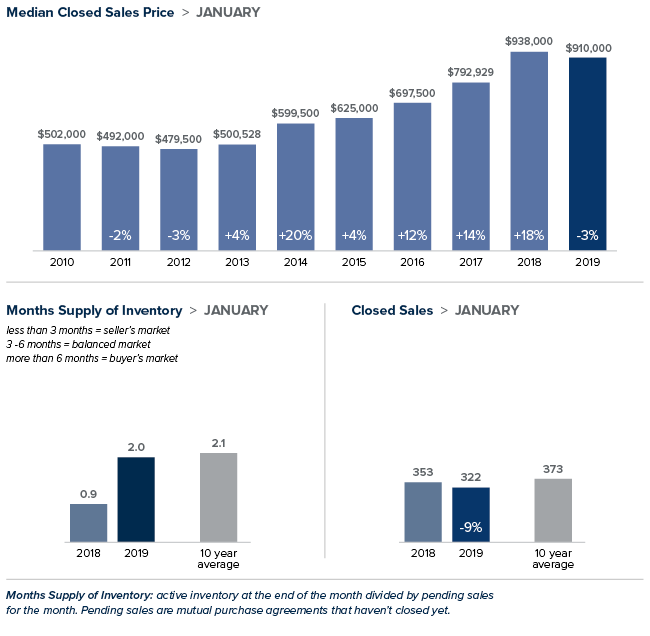
The most expensive region in King County saw prices soften in January. The median price of a single-family home on the Eastside dropped 3 percent over last January to $910,000. It’s an excellent time for buyers to leverage the cooling market and negotiate terms that work best for their needs. Last January, 39 percent of the homes in this area sold for over asking price. This January, that figure dropped to 12 percent. With its favorable business climate and high rankings for both economic growth and technology capabilities, demand on the Eastside is projected to remain strong.
King County

>>>Click image to view full report.
January marked the first time home prices in King County decreased year-over-year in seven years. The median price of a single-family home was $610,0000, a drop of 3 percent over the prior year. Inventory more than doubled. Unlike recent months, this was due primarily to more people putting their homes on the market, as opposed to homes taking longer to sell. Despite the surge in listings there is just two months of available inventory, far short of what is needed to meet demand.
Seattle
>>>Click image to view full report.
The median price of a single-family home in the city was $711,500 in January, a decrease of 6 percent year-over-year. Despite a 107 percent increase in homes for sale compared to a year ago, Seattle continues to have the tightest inventory in King County with less than two months of supply. A booming economy that shows no signs of slowing continues to draw more people to the city. The area will have to significantly add more inventory to meet that growing demand.
Snohomish County

>>>Click image to view full report.
The median price of a single-family home in January inched up 1 percent from last year to $455,000. That price is down from the median of $470,000 recorded in December. Snohomish County also saw a surge in inventory with the number of homes on the market double of what it was last year at this time.
This post originally appeared on the WindermereEastside.com Blog.
The Gardner Report – Fourth Quarter 2018


The following analysis of the Western Washington real estate market is provided by Windermere Real Estate Chief Economist Matthew Gardner. We hope that this information may assist you with making better-informed real estate decisions. For further information about the housing market in your area, please don’t hesitate to contact me.
Economic Overview
The Washington State economy continues to add jobs at an above-average rate, though the pace of growth is starting to slow as the business cycle matures. Over the past 12 months, the state added 96,600 new jobs, representing an annual growth rate of 2.9% — well above the national rate of 1.7%. Private sector employment gains continue to be quite strong, increasing at an annual rate of 3.6%. Public sector employment was down 0.3%. The strongest growth sectors were Real Estate Brokerage and Leasing (+11.4%), Employment Services (+10.3%), and Residential Construction (+10.2%). During fourth quarter, the state’s unemployment rate was 4.3%, down from 4.7% a year ago.
My latest economic forecast suggests that statewide job growth in 2019 will still be positive but is expected to slow. We should see an additional 83,480 new jobs, which would be a year-over-year increase of 2.4%.
Home Sales Activity
- There were 17,353 home sales during the fourth quarter of 2018. Year-over-year sales growth started to slow in the third quarter and this trend continued through the end of the year. Sales were down 16% compared to the fourth quarter of 2017.
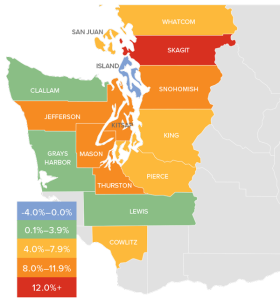
- The slowdown in home sales was mainly a function of increasing listing activity, which was up 38.8% compared to the fourth quarter of 2017 (continuing a trend that started earlier in the year). Almost all of the increases in listings were in King and Snohomish Counties. There were more modest increases in Pierce, Thurston, Kitsap, Skagit, and Island Counties. Listing activity was down across the balance of the region.
- Only two counties—Mason and Lewis—saw sales rise compared to the fourth quarter of 2017, with the balance of the region seeing lower levels of sales activity.
- We saw the traditional drop in listings in the fourth quarter compared to the third quarter, but I fully anticipate that we will see another jump in listings when the spring market hits. The big question will be to what degree listings will rise.

Home Prices
-
 With greater choice, home price growth in Western Washington continued to slow in fourth quarter, with a year-over-year increase of 5% to $486,667. Notably, prices were down 3.3% compared to the third quarter of 2018.
 -
Home prices, although higher than a year ago, continue to slow. As mentioned earlier, we have seen significant increases in inventory and this will slow down price gains. I maintain my belief that this is a good thing, as the pace at which home prices were rising was unsustainable.
-
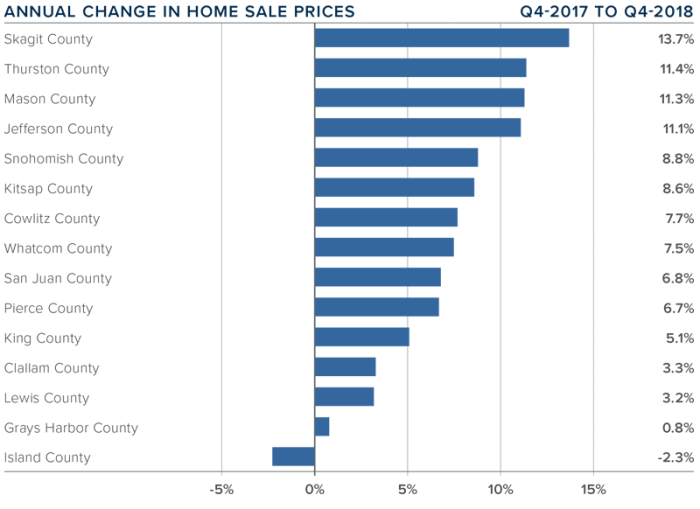
When compared to the same period a year ago, price growth was strongest in Skagit County, where home prices were up 13.7%. Three other counties experienced double-digit price increases.
-
Price growth has been moderating for the past two quarters and I believe that we have reached a price ceiling in many markets. I would not be surprised to see further drops in prices across the region in the first half of 2019, but they should start to resume their upward trend in the second half of the year.
Days on Market
-
The average number of days it took to sell a home dropped three days compared to the same quarter of 2017.
- Thurston County joined King County as the tightest markets in Western Washington, with homes taking an average of 35 days to sell. There were eight counties that saw the length of time it took to sell a home drop compared to the same period a year ago. Market time rose in five counties and was unchanged in two.
-
Across the entire region, it took an average of 51 days to sell a home in the fourth quarter of 2018. This is down from 54 days in the fourth quarter of 2017 but up by 12 days when compared to the third quarter of 2018.
-
I suggested in the third quarter Gardner Report that we should be prepared for days on market to increase, and that has proven to be accurate. I expect this trend will continue, but this is typical of a regional market that is moving back to becoming balanced.

Conclusions

This speedometer reflects the state of the region’s real estate market using housing inventory, price gains, home sales, interest rates, and larger economic factors. I am continuing to move the needle toward buyers as price growth moderates and listing inventory continues to rise.
2019 will be the year that we get closer to having a more balanced housing market. Buyer and seller psychology will continue to be significant factors as home sellers remain optimistic about the value of their home, while buyers feel significantly less pressure to buy. Look for the first half of 2019 to be fairly slow as buyers sit on the sidelines waiting for price stability, but then I do expect to see a more buoyant second half of the year.

As Chief Economist for Windermere Real Estate, Matthew Gardner is responsible for analyzing and interpreting economic data and its impact on the real estate market on both a local and national level. Matthew has over 30 years of professional experience both in the U.S. and U.K.
In addition to his day-to-day responsibilities, Matthew sits on the Washington State Governors Council of Economic Advisors; chairs the Board of Trustees at the Washington Center for Real Estate Research at the University of Washington; and is an Advisory Board Member at the Runstad Center for Real Estate Studies at the University of Washington where he also lectures in real estate economics.
This post originally appeared on the Windermere.com Blog.


