 Facebook
 X
X
 Pinterest
 Copy Link
The Gardner Report – First Quarter 2020


The following analysis of the Western Washington real estate market is provided by Windermere Real Estate Chief Economist, Matthew Gardner. I hope that this information may assist you in making better-informed real estate decisions. For further information about the housing market in your area, please don’t hesitate to contact me.
A MESSAGE FROM MATTHEW GARDNER
Needless to say, any discussion about the U.S. economy, state economy, or housing markets in the first quarter of this year is almost meaningless given events surrounding the COVID-19 virus.
Although you will see below data regarding housing activity in the region, many markets came close to halting transactions in March and many remain in some level of paralysis. As such, drawing conclusions from the data is almost a futile effort. I would say, though, it is my belief that the national and state housing markets were in good shape before the virus hit and will be in good shape again, once we come out on the other side. In a similar fashion, I anticipate the national and regional economies will start to thaw, and that many of the jobs lost will return with relative speed. Of course, all of these statements are wholly dependent on the country seeing a peak in new infections in the relatively near future. I stand by my contention that the housing market will survive the current economic crisis and it is likely we will resume a more normalized pattern of home sales in the second half of the year.
HOME SALES
- There were 13,378 home sales during the first quarter of 2020, a drop of only 0.2% from the same period in 2019, but 27% lower than in the final quarter of 2019.
- The number of homes for sale was 32% lower than a year ago and was also 32% lower than in the fourth quarter of 2019.
- When compared to the first quarter of 2019 sales rose in eight counties and dropped in seven. The greatest growth was in Cowlitz and Lewis counties. The largest declines were in Island and Snohomish counties.
- Pending sales — a good gauge of future closings — rose 0.7% compared to the final quarter of 2019. We can be assured that closed sales in the second quarter of this year will be lower due to COVID-19.


HOME PRICES
- Home-price growth in Western Washington rose compared to a year ago, with average prices up 8.7%. The average sale price in Western Washington was $524,392, and prices were 0.4% higher than in the fourth quarter of 2019.
- Home prices were higher in every county except San Juan, which is prone to significant swings in average sale prices because of its size.
- When compared to the same period a year ago, price growth was strongest in Clallam County, where home prices were up 21.7%. Double-digit price increases were also seen in Kitsap, Skagit, Mason, Thurston, and Snohomish counties.
- Affordability issues remain and, even given the current uncertain environment, I believe it is highly unlikely we will see any form of downward price pressures once the region reopens.

DAYS ON MARKET
- The average number of days it took to sell a home in the first quarter of this year dropped seven days compared to the first quarter of 2019.
- Pierce County was the tightest market in Western Washington, with homes taking an average of only 29 days to sell. All but two counties — San Juan and Clallam — saw the length of time it took to sell a home drop compared to the same period a year ago.
- Across the entire region, it took an average of 54 days to sell a home in the first quarter of the year — up 8 days compared to the fourth quarter of 2019.
- Market time remains below the long-term average across the region. This is likely to change, albeit temporarily, in the second quarter due to COVID-19.

CONCLUSIONS
 This speedometer reflects the state of the region’s real estate market using housing inventory, price gains, home sales, interest rates, and larger economic factors.
Given the current economic environment, I have decided to freeze the needle in place until we see a restart in the economy. Once we have resumed “normal” economic activity, there will be a period of adjustment with regard to housing. Therefore, it is appropriate to wait until later in the year to offer my opinions about any quantitative impact the pandemic will have on the housing market.
ABOUT MATTHEW GARDNER
 As Chief Economist for Windermere Real Estate, Matthew Gardner is responsible for analyzing and interpreting economic data and its impact on the real estate market on both a local and national level. Matthew has over 30 years of professional experience both in the U.S. and U.K.
In addition to his day-to-day responsibilities, Matthew sits on the Washington State Governors Council of Economic Advisors; chairs the Board of Trustees at the Washington Center for Real Estate Research at the University of Washington; and is an Advisory Board Member at the Runstad Center for Real Estate Studies at the University of Washington where he also lectures in real estate economics.
This post originally appeared on the Windermere.com Blog.
The Gardner Report – Third Quarter 2019

The following analysis of the Western Washington real estate market is provided by Windermere Real Estate Chief Economist, Matthew Gardner. We hope that this information may assist you with making better-informed real estate decisions. For further information about the housing market in your area, please don’t hesitate to contact your Windermere agent.
Economic Overview
Washington State employment has softened slightly to an annual growth rate of 2%, which is still a respectable number compared to other West Coast states and the country as a whole. In all, I expect that Washington will continue to add jobs at a reasonable rate though it is clear that businesses are starting to feel the effects of the trade war with China and this is impacting hiring practices. The state unemployment rate was 4.6%, marginally higher than the 4.4% level of a year ago. My most recent economic forecast suggests that statewide job growth in 2019 will rise by 2.2%, with a total of 88,400 new jobs created.
Home Sales Activity
- There were 22,685 home sales during the third quarter of 2019, representing a slight increase of 0.8% from the same period in 2018 and essentially at the same level as in the second quarter.
- Listing activity — which rose substantially from the middle of last year — appears to have settled down. This is likely to slow sales as there is less choice in the market.
- Compared to the third quarter of 2018, sales rose in five counties, remained static in one, and dropped in nine. The greatest growth was in Skagit and Clallam counties. Jefferson, Kitsap, and Cowlitz counties experienced significant declines.
- The average number of homes for sale rose 11% between the second and third quarters. However, inventory is 14% lower than in the same quarter of 2018. In fact, no county contained in this report had more homes for sale in the third quarter than a year ago.


Home Prices

- Home price growth in Western Washington notched a little higher in the third quarter, with average prices 4.2% higher than a year ago. The average sales price in Western Washington was $523,016. It is worth noting, though, that prices were down 3.3% compared to the second quarter of this year.
- Home prices were higher in every county except Island, though the decline there was very small.
- When compared to the same period a year ago, price growth was strongest in Grays Harbor County, where home prices were up 22%. San Juan, Jefferson, and Cowlitz counties also saw double-digit price increases.
- Affordability issues are driving buyers further out which is resulting in above-average price growth in outlying markets. I expect home prices to continue appreciating as we move through 2020, but the pace of growth will continue to slow.

Days on Market
- The average number of days it took to sell a home dropped one day when compared to the third quarter of 2018.
- Thurston County was the tightest market in Western Washington, with homes taking an average of only 20 days to sell. There were six counties where the length of time it took to sell a home dropped compared to the same period a year ago. Market time rose in six counties, while two counties were unchanged.
- Across the entire region, it took an average of 38 days to sell a home in the third quarter. This was down 3 days compared to the second quarter of this year.
- Market time remains below the long-term average across the region and this trend is likely to continue until more inventory comes to market, which I do not expect will happen until next spring.

Conclusions

This speedometer reflects the state of the region’s real estate market using housing inventory, price gains, home sales, interest rates, and larger economic factors. I am leaving the needle in the same position as the first and second quarters, as demand appears to still be strong.
The market continues to benefit from low mortgage rates. The average 30-year fixed rates is currently around 3.6% and is unlikely to rise significantly anytime soon. Even as borrowing costs remain very competitive, it’s clear buyers are not necessarily jumping at any home that comes on the market. Although it’s still a sellers’ market, buyers have become increasingly price-conscious which is reflected in slowing home price growth.

As Chief Economist for Windermere Real Estate, Matthew Gardner is responsible for analyzing and interpreting economic data and its impact on the real estate market on both a local and national level. Matthew has over 30 years of professional experience both in the U.S. and U.K.
In addition to his day-to-day responsibilities, Matthew sits on the Washington State Governors Council of Economic Advisors; chairs the Board of Trustees at the Washington Center for Real Estate Research at the University of Washington; and is an Advisory Board Member at the Runstad Center for Real Estate Studies at the University of Washington where he also lectures in real estate economics.
This post originally appeared on the Windermere.com Blog.
The Gardner Report – Fourth Quarter 2018


The following analysis of the Western Washington real estate market is provided by Windermere Real Estate Chief Economist Matthew Gardner. We hope that this information may assist you with making better-informed real estate decisions. For further information about the housing market in your area, please don’t hesitate to contact me.
Economic Overview
The Washington State economy continues to add jobs at an above-average rate, though the pace of growth is starting to slow as the business cycle matures. Over the past 12 months, the state added 96,600 new jobs, representing an annual growth rate of 2.9% — well above the national rate of 1.7%. Private sector employment gains continue to be quite strong, increasing at an annual rate of 3.6%. Public sector employment was down 0.3%. The strongest growth sectors were Real Estate Brokerage and Leasing (+11.4%), Employment Services (+10.3%), and Residential Construction (+10.2%). During fourth quarter, the state’s unemployment rate was 4.3%, down from 4.7% a year ago.
My latest economic forecast suggests that statewide job growth in 2019 will still be positive but is expected to slow. We should see an additional 83,480 new jobs, which would be a year-over-year increase of 2.4%.
Home Sales Activity
- There were 17,353 home sales during the fourth quarter of 2018. Year-over-year sales growth started to slow in the third quarter and this trend continued through the end of the year. Sales were down 16% compared to the fourth quarter of 2017.
- The slowdown in home sales was mainly a function of increasing listing activity, which was up 38.8% compared to the fourth quarter of 2017 (continuing a trend that started earlier in the year). Almost all of the increases in listings were in King and Snohomish Counties. There were more modest increases in Pierce, Thurston, Kitsap, Skagit, and Island Counties. Listing activity was down across the balance of the region.
- Only two counties—Mason and Lewis—saw sales rise compared to the fourth quarter of 2017, with the balance of the region seeing lower levels of sales activity.
- We saw the traditional drop in listings in the fourth quarter compared to the third quarter, but I fully anticipate that we will see another jump in listings when the spring market hits. The big question will be to what degree listings will rise.

Home Prices
-
With greater choice, home price growth in Western Washington continued to slow in fourth quarter, with a year-over-year increase of 5% to $486,667. Notably, prices were down 3.3% compared to the third quarter of 2018.
-
Home prices, although higher than a year ago, continue to slow. As mentioned earlier, we have seen significant increases in inventory and this will slow down price gains. I maintain my belief that this is a good thing, as the pace at which home prices were rising was unsustainable.
-
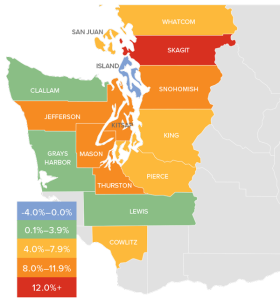
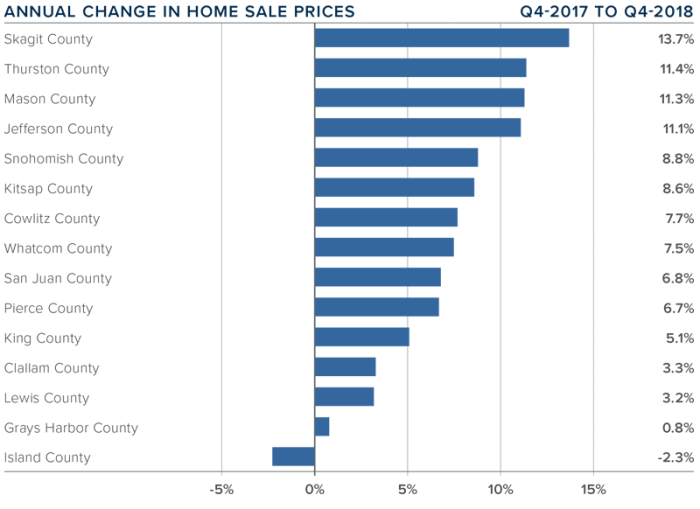
When compared to the same period a year ago, price growth was strongest in Skagit County, where home prices were up 13.7%. Three other counties experienced double-digit price increases.
-
Price growth has been moderating for the past two quarters and I believe that we have reached a price ceiling in many markets. I would not be surprised to see further drops in prices across the region in the first half of 2019, but they should start to resume their upward trend in the second half of the year.
Days on Market
-
The average number of days it took to sell a home dropped three days compared to the same quarter of 2017.
- Thurston County joined King County as the tightest markets in Western Washington, with homes taking an average of 35 days to sell. There were eight counties that saw the length of time it took to sell a home drop compared to the same period a year ago. Market time rose in five counties and was unchanged in two.
-
Across the entire region, it took an average of 51 days to sell a home in the fourth quarter of 2018. This is down from 54 days in the fourth quarter of 2017 but up by 12 days when compared to the third quarter of 2018.
-
I suggested in the third quarter Gardner Report that we should be prepared for days on market to increase, and that has proven to be accurate. I expect this trend will continue, but this is typical of a regional market that is moving back to becoming balanced.

Conclusions

This speedometer reflects the state of the region’s real estate market using housing inventory, price gains, home sales, interest rates, and larger economic factors. I am continuing to move the needle toward buyers as price growth moderates and listing inventory continues to rise.
2019 will be the year that we get closer to having a more balanced housing market. Buyer and seller psychology will continue to be significant factors as home sellers remain optimistic about the value of their home, while buyers feel significantly less pressure to buy. Look for the first half of 2019 to be fairly slow as buyers sit on the sidelines waiting for price stability, but then I do expect to see a more buoyant second half of the year.

As Chief Economist for Windermere Real Estate, Matthew Gardner is responsible for analyzing and interpreting economic data and its impact on the real estate market on both a local and national level. Matthew has over 30 years of professional experience both in the U.S. and U.K.
In addition to his day-to-day responsibilities, Matthew sits on the Washington State Governors Council of Economic Advisors; chairs the Board of Trustees at the Washington Center for Real Estate Research at the University of Washington; and is an Advisory Board Member at the Runstad Center for Real Estate Studies at the University of Washington where he also lectures in real estate economics.
This post originally appeared on the Windermere.com Blog.
2019 Economic and Housing Forecast


What a year it has been for both the U.S. economy and the national housing market. After several years of above-average economic and home price growth, 2018 marked the start of a slowdown in the residential real estate market. As the year comes to a close, it’s time for me to dust off my crystal ball to see what we can expect in 2019.
The U.S. Economy
Despite the turbulence that the ongoing trade wars with China are causing, I still expect the U.S. economy to have one more year of relatively solid growth before we likely enter a recession in 2020. Yes, it’s the dreaded “R” word, but before you panic, there are some things to bear in mind.
Firstly, any cyclical downturn will not be driven by housing. Although it is almost impossible to predict exactly what will be the “straw that breaks the camel’s back”, I believe it will likely be caused by one of the following three things: an ongoing trade war, the Federal Reserve raising interest rates too quickly, or excessive corporate debt levels. That said, we still have another year of solid growth ahead of us, so I think it’s more important to focus on 2019 for now.
The U.S. Housing Market
Existing Home Sales
This paper is being written well before the year-end numbers come out, but I expect 2018 home sales will be about 3.5% lower than the prior year. Sales started to slow last spring as we breached affordability limits and more homes came on the market. In 2019, I anticipate that home sales will rebound modestly and rise by 1.9% to a little over 5.4 million units.
Existing Home Prices
We will likely end 2018 with a median home price of about $260,000 – up 5.4% from 2017. In 2019 I expect prices to continue rising, but at a slower rate as we move toward a more balanced housing market. I’m forecasting the median home price to increase by 4.4% as rising mortgage rates continue to act as a headwind to home price growth.
New Home Sales
In a somewhat similar manner to existing home sales, new home sales started to slow in the spring of 2018, but the overall trend has been positive since 2011. I expect that to continue in 2019 with sales increasing by 6.9% to 695,000 units – the highest level seen since 2007.
That being said, the level of new construction remains well below the long-term average. Builders continue to struggle with land, labor, and material costs, and this is an issue that is not likely to be solved in 2019. Furthermore, these constraints are forcing developers to primarily build higher-priced homes, which does little to meet the substantial demand by first-time buyers.
Mortgage Rates
In last year’s forecast I suggested that 5% interest rates would be a 2019 story, not a 2018 story. This prediction has proven accurate with the average 30-year conforming rates measured at 4.87% in November, and highly unlikely to breach the 5% barrier before the end of the year.
In 2019, I expect interest rates to continue trending higher, but we may see periods of modest contraction or leveling. We will likely end the year with the 30-year fixed rate at around 5.7%, which means that 6% interest rates are more apt to be a 2020 story.
I also believe that non-conforming (or jumbo) rates will remain remarkably competitive. Banks appear to be comfortable with the risk and ultimately, the return, that this product offers, so expect jumbo loan yields to track conforming loans quite closely.
Conclusions
There are still voices out there that seem to suggest the housing market is headed for calamity and that another housing bubble is forming, or in some cases, is already deflating. In all the data that I review, I just don’t see this happening. Credit quality for new mortgage holders remains very high and the median down payment (as a percentage of home price) is at its highest level since 2004.
That is not to say that there aren’t several markets around the country that are overpriced, but just because a market is overvalued, does not mean that a bubble is in place. It simply means that forward price growth in these markets will be lower to allow income levels to rise sufficiently.
Finally, if there is a big story for 2019, I believe it will be the ongoing resurgence of first-time buyers. While these buyers face challenges regarding student debt and the ability to save for a down payment, they are definitely on the comeback and likely to purchase more homes next year than any other buyer demographic.
Originally published on Inman News and the Windermere.com Blog.
Matthew Gardner is the Chief Economist for Windermere Real Estate, specializing in residential market analysis, commercial/industrial market analysis, financial analysis, and land use and regional economics. He is the former Principal of Gardner Economics, and has more than 30 years of professional experience both in the U.S. and U.K.
What to Expect From Property Taxes in Washington State in 2018-2019

Why have property taxes gone up so much in Washington State this year and what can we expect them to do in 2019? Windermere Chief Economist Matthew Gardner answers the question that many homeowners are asking.
This post originally appeared on the Windermere.com Blog.
The Gardner Report – Fourth Quarter 2017


Economic Overview
The Washington State economy added 104,600 new jobs over the past 12 months. This impressive growth rate of 3.1% is well above the national rate of 1.4%. Interestingly, the slowdown we saw through most of the second half of the year reversed in the fall, and we actually saw more robust employment growth.
Growth continues to be broad-based, with expansion in all major job sectors other than aerospace due to a slowdown at Boeing.
With job creation, the state unemployment rate stands at 4.5%, essentially indicating that the state is close to full employment. Additionally, all counties contained within this report show unemployment rates below where they were a year ago.
I expect continued economic expansion in Washington State in 2018; however, we are likely to see a modest slowdown, which is to be expected at this stage in the business cycle.
Home Sales Activity
- There were 22,325 home sales during the final quarter of 2017. This is an increase of 3.7% over the same period in 2016.
- Jefferson County saw sales rise the fastest relative to fourth quarter of 2016, with an impressive increase of 22.8%. Six other counties saw double-digit gains in sales. A lack of listings impacted King and Skagit Counties, where sales fell.
- Housing inventory was down by 16.2% when compared to the fourth quarter of 2016, and down by 17.3% from last quarter. This isn’t terribly surprising since we typically see a slowdown as we enter the winter months. Pending home sales rose by 4.1% over the third quarter of 2017, suggesting that closings in the first quarter of 2018 should be robust.
- The takeaway from this data is that listings remain at very low levels and, unfortunately, I don’t expect to see substantial increases in 2018. The region is likely to remain somewhat starved for inventory for the foreseeable future.

Home Prices
 Because of low inventory in the fall of 2017, price growth was well above long-term averages across Western Washington. Year-over-year, average prices rose 12% to $466,726.
- Economic vitality in the region is leading to a demand for housing that far exceeds supply. Given the relative lack of newly constructed homes—something that is unlikely to change any time soon—there will continue to be pressure on the resale market. This means home prices will rise at above-average rates in 2018.
- Compared to the same period a year ago, price growth was most pronounced in Lewis County, where home prices were 18.8% higher than a year ago. Eleven additional counties experienced double-digit price growth as well.
- Mortgage rates in the fourth quarter rose very modestly, but remained below the four percent barrier. Although I anticipate rates will rise in 2018, the pace will be modest. My current forecast predicts an average 30-year rate of 4.4% in 2018—still remarkably low when compared to historic averages.
 Because of low inventory in the fall of 2017, price growth was well above long-term averages across Western Washington. Year-over-year, average prices rose 12% to $466,726.
Days on Market
- The average number of days it took to sell a home in the fourth quarter dropped by eight days, compared to the same quarter of 2016.
- King County continues to be the tightest market in Western Washington, with homes taking an average of 21 days to sell. Every county in the region saw the length of time it took to sell a home either drop or remain static relative to the same period a year ago.
- Last quarter, it took an average of 50 days to sell a home. This is down from 58 days in the fourth quarter of 2016, but up by 7 days from the third quarter of 2017.
- As mentioned earlier in this report, I expect inventory levels to rise modestly, which should lead to an increase in the average time it takes to sell a house. That said, with homes selling in less than two months on average, the market is nowhere near balanced.

Conclusions
 This speedometer reflects the state of the region’s housing market using housing inventory, price gains, home sales, interest rates, and larger economic factors. For the fourth quarter of 2017, I have left the needle at the same point as third quarter. Price growth remains robust even as sales activity slowed. 2018 is setting itself up to be another very good year for housing.
Matthew Gardner is the Chief Economist for Windermere Real Estate, specializing in residential market analysis, commercial/industrial market analysis, financial analysis, and land use and regional economics. He is the former Principal of Gardner Economics, and has more than 30 years of professional experience both in the U.S. and U.K.
This article originally appeared on the Windermere.com blog.
2018 Housing Forecast: Where are we headed?


What lies ahead for the local housing market in 2018? We sat down with Windermere Chief Economist Matthew Gardner to get his thoughts. Here are some highlights:
Home prices will continue to increase, but at a slower pace
The strong local economy, high demand and very low inventory will continue to boost home values in 2018, according to Gardner. However, he believes that the double-digit growth of 2017 will moderate, and predicts home prices in King County will rise by 8.5% in the new year.
Mortgage interest rates will rise slightly.
Gardner admits that interest rates continue to baffle forecasters. The rise that many economists have predicted the past few years has yet to materialize. His forecast for 2018 sees interest rates increasing modestly to an average of 4.4% for a conventional 30-year fixed-rate mortgage.
More Millennials will enter the housing market.
Despite the relatively high cost of homes in our region, Gardner expects more Millennials to buy homes in 2018. They are getting older and more established in their careers, enabling them to save more money for a down payment. Many are also having children and are looking for a place to raise their family.
The tax reform bill will have a limited effect on our housing market.
The recent changes to the income tax structure will have an impact on homeowners, but Gardner does not believe that impact will be significant here.
-
-
The mortgage interest rate deduction will be capped at $750,000 – down from $1,000,000. But according to Gardner, just 4% of the mortgages in King County exceeded $750,000 in 2017. Most buyers of more expensive homes have been making larger down payments, or buying homes for cash.
-
Since the $1,000,000 mortgage deduction cap is grandfathered in for those who have already purchased a home, some homeowners may opt to stay put rather than move. That could result in fewer homes being placed on the market.
- The tax bill eliminates the deduction for interest on home equity loans. This is bound to slow down the trend of homeowners choosing to remodel their home rather than trying to find a new home our inventory-deprived market.
-
Bottom Line
The increase in home prices may moderate, but inventory will still be very tight. 2018 is on track to be a strong seller’s market.
This post was originally featured on the Windermere Eastside Blog.


