 Facebook
 X
X
 Pinterest
 Copy Link
The Gardner Report – First Quarter 2020


The following analysis of the Western Washington real estate market is provided by Windermere Real Estate Chief Economist, Matthew Gardner. I hope that this information may assist you in making better-informed real estate decisions. For further information about the housing market in your area, please don’t hesitate to contact me.
A MESSAGE FROM MATTHEW GARDNER
Needless to say, any discussion about the U.S. economy, state economy, or housing markets in the first quarter of this year is almost meaningless given events surrounding the COVID-19 virus.
Although you will see below data regarding housing activity in the region, many markets came close to halting transactions in March and many remain in some level of paralysis. As such, drawing conclusions from the data is almost a futile effort. I would say, though, it is my belief that the national and state housing markets were in good shape before the virus hit and will be in good shape again, once we come out on the other side. In a similar fashion, I anticipate the national and regional economies will start to thaw, and that many of the jobs lost will return with relative speed. Of course, all of these statements are wholly dependent on the country seeing a peak in new infections in the relatively near future. I stand by my contention that the housing market will survive the current economic crisis and it is likely we will resume a more normalized pattern of home sales in the second half of the year.
HOME SALES
- There were 13,378 home sales during the first quarter of 2020, a drop of only 0.2% from the same period in 2019, but 27% lower than in the final quarter of 2019.
- The number of homes for sale was 32% lower than a year ago and was also 32% lower than in the fourth quarter of 2019.
- When compared to the first quarter of 2019 sales rose in eight counties and dropped in seven. The greatest growth was in Cowlitz and Lewis counties. The largest declines were in Island and Snohomish counties.
- Pending sales — a good gauge of future closings — rose 0.7% compared to the final quarter of 2019. We can be assured that closed sales in the second quarter of this year will be lower due to COVID-19.


HOME PRICES
- Home-price growth in Western Washington rose compared to a year ago, with average prices up 8.7%. The average sale price in Western Washington was $524,392, and prices were 0.4% higher than in the fourth quarter of 2019.
- Home prices were higher in every county except San Juan, which is prone to significant swings in average sale prices because of its size.
- When compared to the same period a year ago, price growth was strongest in Clallam County, where home prices were up 21.7%. Double-digit price increases were also seen in Kitsap, Skagit, Mason, Thurston, and Snohomish counties.
- Affordability issues remain and, even given the current uncertain environment, I believe it is highly unlikely we will see any form of downward price pressures once the region reopens.

DAYS ON MARKET
- The average number of days it took to sell a home in the first quarter of this year dropped seven days compared to the first quarter of 2019.
- Pierce County was the tightest market in Western Washington, with homes taking an average of only 29 days to sell. All but two counties — San Juan and Clallam — saw the length of time it took to sell a home drop compared to the same period a year ago.
- Across the entire region, it took an average of 54 days to sell a home in the first quarter of the year — up 8 days compared to the fourth quarter of 2019.
- Market time remains below the long-term average across the region. This is likely to change, albeit temporarily, in the second quarter due to COVID-19.

CONCLUSIONS
 This speedometer reflects the state of the region’s real estate market using housing inventory, price gains, home sales, interest rates, and larger economic factors.
Given the current economic environment, I have decided to freeze the needle in place until we see a restart in the economy. Once we have resumed “normal” economic activity, there will be a period of adjustment with regard to housing. Therefore, it is appropriate to wait until later in the year to offer my opinions about any quantitative impact the pandemic will have on the housing market.
ABOUT MATTHEW GARDNER
 As Chief Economist for Windermere Real Estate, Matthew Gardner is responsible for analyzing and interpreting economic data and its impact on the real estate market on both a local and national level. Matthew has over 30 years of professional experience both in the U.S. and U.K.
In addition to his day-to-day responsibilities, Matthew sits on the Washington State Governors Council of Economic Advisors; chairs the Board of Trustees at the Washington Center for Real Estate Research at the University of Washington; and is an Advisory Board Member at the Runstad Center for Real Estate Studies at the University of Washington where he also lectures in real estate economics.
This post originally appeared on the Windermere.com Blog.
The Gardner Report – Third Quarter 2018


The following analysis of the Western Washington real estate market is provided by Windermere Real Estate Chief Economist Matthew Gardner. We hope that this information may assist you with making better-informed real estate decisions. For further information about the housing market in your area, please don’t hesitate to contact your Windermere Agent.
Economic Overview
Washington State continues to be one of the fastest growing states in the nation and there is little to suggest that there will be any marked slowdown in the foreseeable future. Over the past year, the state has added 105,900 new jobs, representing an annual growth rate of 3.2%. This remains well above the national rate of 1.65%. Private sector employment gains continue to be robust, increasing at an annual rate of 3.7%. The strongest growth sectors were Construction (+7.4%), Information (+6.2%), and Professional & Business Services (+6.1%). The state’s unemployment rate was 4.5%, down from 4.8% a year ago.
All year I’ve been predicting that Washington State’s annual job growth would outperform the nation as a whole, and we now know with certainty that this is going to be the case. Furthermore, I am now able to predict that statewide job growth in 2019 will be equally strong, with an expected increase of 2.6%.
Home Sales Activity
-
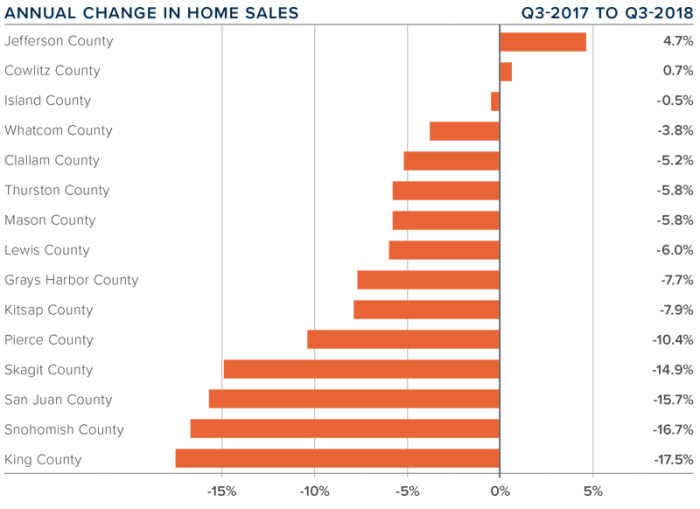
There were 22,310 home sales during the third quarter of 2018. This is a significant drop of 12.7% compared to the third quarter of 2017.
-
The number of homes for sale last quarter was up 14.5% compared to the third quarter of 2017, continuing a trend that started earlier in the year. However, the increase in listings was only in Seattle’s tri-county area (King, Pierce, and Snohomish Counties) while listing activity was down across the balance of the region.
-
Only two counties had a year-over-year increase in home sales, while the rest of Western Washington saw sales decrease.
-
The region has reached an inflection point. With the increase in the number of homes for sale, buyers now have more choices and time to make a decision about what home to buy.
Home Prices

-
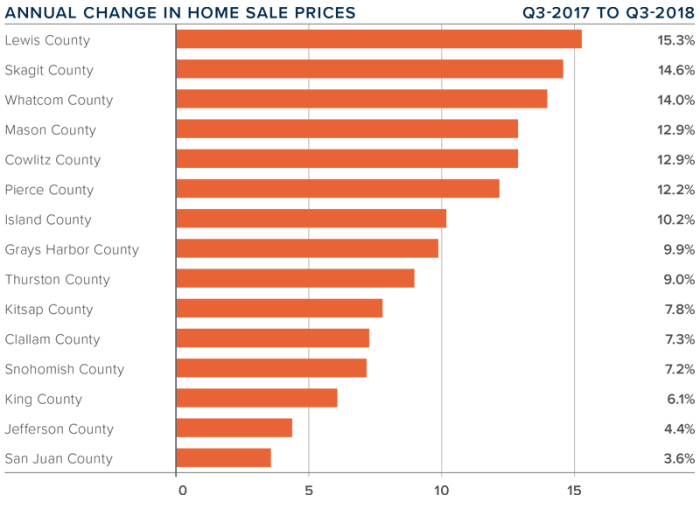
As inventory levels start to rise, some of the heat has been taken off the market, which caused home prices in the Western Washington region to go up by a relatively modest 6.2% over last year to $503,039. Notably, prices are down by 4.4% when compared to the second quarter of this year.
-
Home prices, although higher than a year ago, continue to slow due to the significant increase in the number of homes for sale. This, in my opinion, is a very good thing.
-
When compared to the same period a year ago, price growth was strongest in Lewis County, where home prices were up 15.3%. Six other counties experienced double-digit price increases.
-
Slowing price growth was inevitable; we simply could not sustain the increases we’ve experienced in recent years. Lower rates of appreciation will continue until wage growth catches up.
Days on Market
-
The average number of days it took to sell a home dropped by four days compared to the same quarter of 2017.
- Across the entire region, it took an average of 39 days to sell a home in the third quarter of this year. This is down from 43 days in the third quarter of 2017 and down 2 days when compared to the second quarter of 2018.
-
King County continues to be the tightest market in Western Washington, with homes taking an average of only 19 days to sell. Every county in the region other than Skagit and King — which both saw the time on the market rise by 2 days — saw the length of time it took to sell a home drop when compared to the same period a year ago.
-
More choice in the market would normally suggest that the length of time it takes to sell a home should rise, but the data has yet to show that. That said, compared to last quarter, we are seeing some marked increases in days on market in several counties, which will be reflected in future reports.

Conclusions

This speedometer reflects the state of the region’s real estate market using housing inventory, price gains, home sales, interest rates, and larger economic factors. I started to move the needle toward buyers last quarter and have moved it even further this quarter. Price growth continues to slow, but more significant is the rise in listings, which I expect to continue as we move toward the quieter winter period.
I believe that psychology will start to play a part in the housing market going forward. It has been more than 15 years since we’ve experienced a “balanced” market, so many home buyers and sellers have a hard time remembering what one looks like. Concerns over price drops are overrated and the length of time it’s taking to sell a home is simply trending back to where it used to be in the early 2000s.

Matthew Gardner is the Chief Economist for Windermere Real Estate, specializing in residential market analysis, commercial/industrial market analysis, financial analysis, and land use and regional economics. He is the former Principal of Gardner Economics, and has more than 30 years of professional experience both in the U.S. and U.K.
This post originally appeared on the Windermere.com Blog.
The Gardner Report – Fourth Quarter 2017

Economic Overview
The Washington State economy added 104,600 new jobs over the past 12 months. This impressive growth rate of 3.1% is well above the national rate of 1.4%. Interestingly, the slowdown we saw through most of the second half of the year reversed in the fall, and we actually saw more robust employment growth.
Growth continues to be broad-based, with expansion in all major job sectors other than aerospace due to a slowdown at Boeing.
With job creation, the state unemployment rate stands at 4.5%, essentially indicating that the state is close to full employment. Additionally, all counties contained within this report show unemployment rates below where they were a year ago.
I expect continued economic expansion in Washington State in 2018; however, we are likely to see a modest slowdown, which is to be expected at this stage in the business cycle.
Home Sales Activity
- There were 22,325 home sales during the final quarter of 2017. This is an increase of 3.7% over the same period in 2016.
- Jefferson County saw sales rise the fastest relative to fourth quarter of 2016, with an impressive increase of 22.8%. Six other counties saw double-digit gains in sales. A lack of listings impacted King and Skagit Counties, where sales fell.
- Housing inventory was down by 16.2% when compared to the fourth quarter of 2016, and down by 17.3% from last quarter. This isn’t terribly surprising since we typically see a slowdown as we enter the winter months. Pending home sales rose by 4.1% over the third quarter of 2017, suggesting that closings in the first quarter of 2018 should be robust.
- The takeaway from this data is that listings remain at very low levels and, unfortunately, I don’t expect to see substantial increases in 2018. The region is likely to remain somewhat starved for inventory for the foreseeable future.

Home Prices
 Because of low inventory in the fall of 2017, price growth was well above long-term averages across Western Washington. Year-over-year, average prices rose 12% to $466,726.
- Economic vitality in the region is leading to a demand for housing that far exceeds supply. Given the relative lack of newly constructed homes—something that is unlikely to change any time soon—there will continue to be pressure on the resale market. This means home prices will rise at above-average rates in 2018.
- Compared to the same period a year ago, price growth was most pronounced in Lewis County, where home prices were 18.8% higher than a year ago. Eleven additional counties experienced double-digit price growth as well.
- Mortgage rates in the fourth quarter rose very modestly, but remained below the four percent barrier. Although I anticipate rates will rise in 2018, the pace will be modest. My current forecast predicts an average 30-year rate of 4.4% in 2018—still remarkably low when compared to historic averages.
 Because of low inventory in the fall of 2017, price growth was well above long-term averages across Western Washington. Year-over-year, average prices rose 12% to $466,726.
Days on Market
- The average number of days it took to sell a home in the fourth quarter dropped by eight days, compared to the same quarter of 2016.
- King County continues to be the tightest market in Western Washington, with homes taking an average of 21 days to sell. Every county in the region saw the length of time it took to sell a home either drop or remain static relative to the same period a year ago.
- Last quarter, it took an average of 50 days to sell a home. This is down from 58 days in the fourth quarter of 2016, but up by 7 days from the third quarter of 2017.
- As mentioned earlier in this report, I expect inventory levels to rise modestly, which should lead to an increase in the average time it takes to sell a house. That said, with homes selling in less than two months on average, the market is nowhere near balanced.

Conclusions
 This speedometer reflects the state of the region’s housing market using housing inventory, price gains, home sales, interest rates, and larger economic factors. For the fourth quarter of 2017, I have left the needle at the same point as third quarter. Price growth remains robust even as sales activity slowed. 2018 is setting itself up to be another very good year for housing.
Matthew Gardner is the Chief Economist for Windermere Real Estate, specializing in residential market analysis, commercial/industrial market analysis, financial analysis, and land use and regional economics. He is the former Principal of Gardner Economics, and has more than 30 years of professional experience both in the U.S. and U.K.
This article originally appeared on the Windermere.com blog.


