 Facebook
 Twitter
 Pinterest
 Copy Link
The Washington Real Estate Excise Tax Change: How Will It Affect You?

The Washington real estate excise tax, otherwise known as REET is faced changes January 1, 2020. What are the changes and how will it affect you? If you are planning on buying, selling, or transferring real estate, these are questions you need to know the answers to. This is your guide to how REET is changing and everything you need to be aware of in 2020.
What is the Real Estate Excise Tax?
The real estate excise tax (REET) is simply a tax on real estate when it is sold or interests are transferred. The seller of the home or piece of property is typically the party responsible for paying REET. However, this is a mandatory tax that the buyer is obligated to if the seller doesn’t pay. REET must also be paid when 50% or more of controlling interests are transferred to a different party. In cases where interests of real estate are transferred, the person transferring their share is liable for the tax.
What Changes are Being Made to the Real Estate Excise Tax?
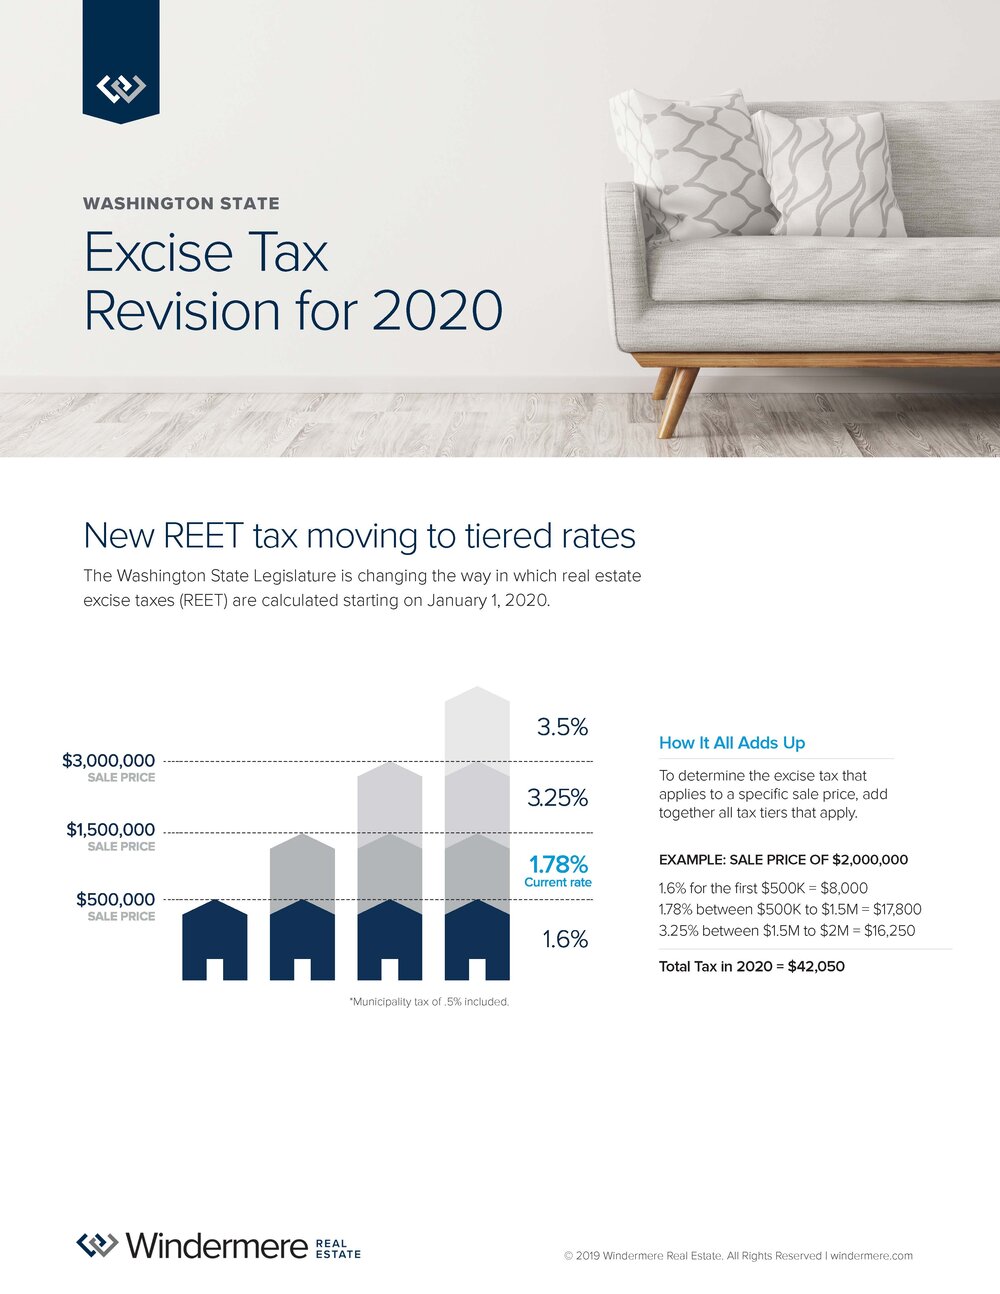
REET is facing monumental changes come the first of the year. The most important change to be aware of is the fee structure. There will no longer be a flat rate percentage for REET. Instead there will be a graduated tier that is as follows:
- Real estate sales of $500,000 and below will pay 1.60% in REET
- Real estate sales between $500,001 and $1,500,000 will pay 1.78% in REET
- Real estate sales between $1,500,001 and $3,000,000 will pay 3.25% in REET
- Real estate sales $3,000,001 and above will pay 3.5% in REET
It is important to mention that the municipality tax of 0.50% is included in the above rates.
Exemptions
Agricultural real estate and timberland are exempt from the new tiered structure. Real estate sales on these two types of properties will continue to remain at 1.28% for REET.
Controlling Interest Transfer Changes
The transfer period will be extended from 12 months to 36 months. The second change is that any transfers of 16% or more will have to be reported during the annual corporate renewal cycle.
How Will REET Changes Affect You?
The changes will have significant impacts on both the sale of real estate and the transfer of controlling interests. Concerning the sale of real estate, valuable properties will see a significant tax hike. Even though the seller is responsible for paying REET, buyers need to beware of purchasing properties with a hidden tax lien for failure to pay REET. As the owner, you may very well be responsible for the unpaid tax.
In order for REET to apply to a controlling interest transfer, 50% or more of the interests must be transferred. However, REET doesn’t apply to just the percentage of interests transferred. It actually applies to 100% of the property’s value.
The Bottom Line on the New REET Changes
How much REET affects the sale of real estate will in most cases depend on the value of the property. Sellers of more valuable properties will feel the changes more than sellers in the first two tiers. Controlling interest transfers are in the same boat as property sellers, meanwhile, agricultural and timberland properties will not feel the effects at all.
If you are buying, selling, and transferring real estate it is important to stay in the know on all changes concerning the real estate transactions. Send me a message to help navigate the changes in the market and get you the most from your next real estate transaction.
This post originally appeared on the RainerTitle.com Blog.
Local Market Update – August 2019

The real estate market continued to moderate in July. Inventory rose and home values softened, providing buyers with increased selection and more favorable pricing. With strong job growth and interest rates holding at below 4 percent, brokers expect the market to remain solid through fall.
EASTSIDE
The market remains strong on the Eastside. The current tech boom continues to fuel demand, buoyed by Google’s recent plans to build out another office in Kirkland. An increase in inventory gives buyers more time to find the right home for their budget. The median price of a single-family home on the Eastside was $925,000 in July, down 2 percent from the same time last year.

KING COUNTY
Home prices in King County continued to ease. Buyers took advantage of lower prices and new inventory to boost home sales in July. The median price of a single-family home was $680,000, a 3 percent decline from the same time last year. More moderately-priced areas in the south end of the county saw continued price growth.

SEATTLE
It’s no surprise that Seattle is the top city in the country where millennials are moving. Apple plans to add 2,000 jobs in Seattle. The first of 4,500 Expedia employees will start moving into Interbay soon. While demand here is expected to stay strong, prices continue to cool. The median price of a single-family home was $755,000, down 6 percent from a year ago and a decrease of 3 percent from June. Southeast Seattle, which generally has more affordable homes, saw the median home price rise 9 percent over the same time last year.

SNOHOMISH COUNTY
Inventory remains very tight in Snohomish County. The number of listings on the market were up 6 percent over last year, and the county has only six weeks of available supply – far short of the four to six months that is considered balanced. The median price of a single-family home in July was $502,000 – up slightly from the median of $495,000 a year ago.

VIEW FULL SNOHOMISH COUNTY REPORT
This post originally appeared on GetTheWReport.com
Local Market Update – June 2019

The pace of the housing market gained momentum in May, bringing an uptick in open house traffic and offers. A drop in interest rates and increased inventory were great incentives for buyers. Despite the increase in supply there is less than two months of inventory available – half the national average and far short of what is considered balanced. Industry experts are predicting a strong market as we segue into summer.
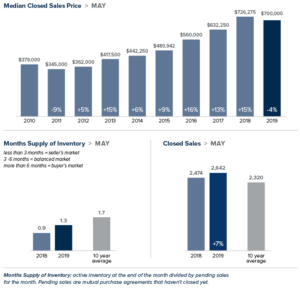
Eastside
>>>Click image to view full report.
The median price of a single-family home on the Eastside was $928,800 in May, down 3% from the same time last year and virtually unchanged from April. With a booming economy that continues to grow, news of Amazon’s expansion in Bellevue, the latest Microsoft acquisition and plans for a $1.2 billion office park in Redmond, demand for housing on the Eastside is unlikely to decrease any time soon.
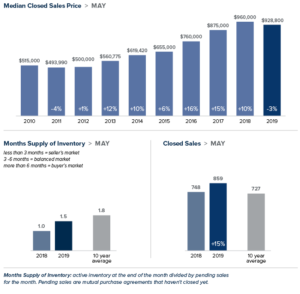
King County
>>>Click image to view full report.
Home sale activity in King County was brisk in May. According to a Windermere analysis, 7 out of 10 properties sold last month had 15 or fewer days on the market. More than half of the homes sold at or above list price. The median price of a single-family home was $700,000. While down 4% from the same time last year, that price was up about $22,000 from the previous month. Home to the fastest growing economy in the country, King County is expected to draw even more buyers to the area this year.
Seattle
>>>Click image to view full report.
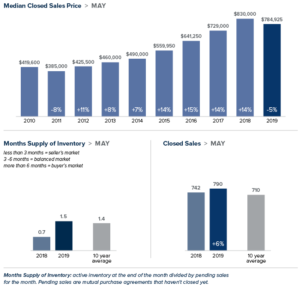
Seattle employment continues to grow faster than in most of the country. This has made the city a top location for workers, particularly millennials. Demand has put a strain on available homes, reducing the supply to just seven weeks of inventory available. May home prices in Seattle were lower than they were a year ago, but showed a healthy increase from the previous month. The median price of a single-family home was $784,925 in May, down 5% from a year ago and up $30,000 from April.
Snohomish County
>>>Click image to view full report.
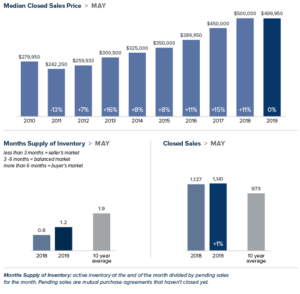
In May, the median price of a single-family home in Snohomish County was $499,950. That number remains unchanged from a year ago, and also unchanged from March and April. Despite a 44% increase in inventory, the supply of homes for sale in this area is even tighter than in King County. Brokers report that buyers are being drawn from King County and willing to trade a longer work commute for more affordable housing.
This post originally appeared on GetTheWReport.com
Local Market Update – May 2019
April brought good news for homebuyers. Inventory increased, prices continued to moderate and mortgage rates remained low. While buyers have more choices, there is still less than two months of inventory on the market. Demand is expected to remain strong as we head into the prime spring real estate season.
Eastside
>>>Click image to view full report.
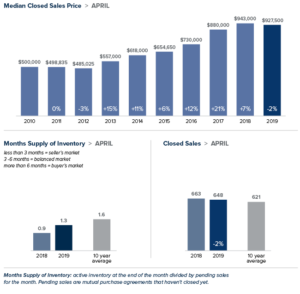
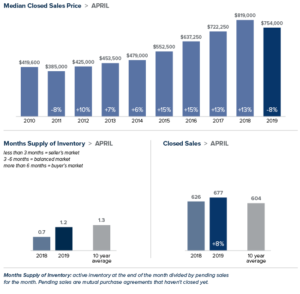
The median price of a single-family home on the Eastside was $927,500 in April, down 2% from the same time last year. The economy here remains robust, particularly in the tech sector. After snapping up substantial real estate in Bellevue earlier this year, Amazon announced in April it would lease two more towers. Buyer demand and scarce inventory are keeping the Eastside market competitive.
King County
>>>Click image to view full report.
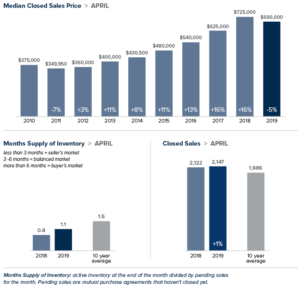
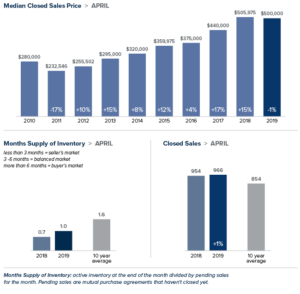
With the number of homes for sale in King County up 78% over last year, buyers have more choices and a bit more time to make a decision. However, there is still less than two months of inventory, half the national average. The median price of a single-family home in April was $690,000. That figure was down 5% from the same time last year, but up from the $677,725 median price in March.
Seattle
>>>Click image to view full report.
With one of the strongest economies in the nation, demand here remains solid. While the number of homes for sale continued to rise, there is just five weeks of available inventory, far short of the four to six months that is considered balanced. The median price of a single-family home in Seattle hit $754,000 in April, down 8% from a year ago and up slightly from the prior month.
Snohomish County
>>>Click image to view full report.
In Snohomish County, the median price of a single-family home fell by 1% from a year ago to $500,000, the same figure posted in March. A 57% increase in inventory combined with low interest rates have created a strong beginning to the spring market.
This post originally appeared on GetTheWReport.com
Eastside Market Review – First Quarter 2019

Local Market Update – April 2019
After months of softening, home prices began to rise in February. That trend continued in March. While prices in most areas were down from the same time last year, they increased over the prior month. New listings rose as well, offering buyers more options and more time to make the right choice. Despite the uptick in listings, inventory is still under two months of supply, far short of the three to six months that is considered balanced.
Eastside

>>>Click image to view full report.
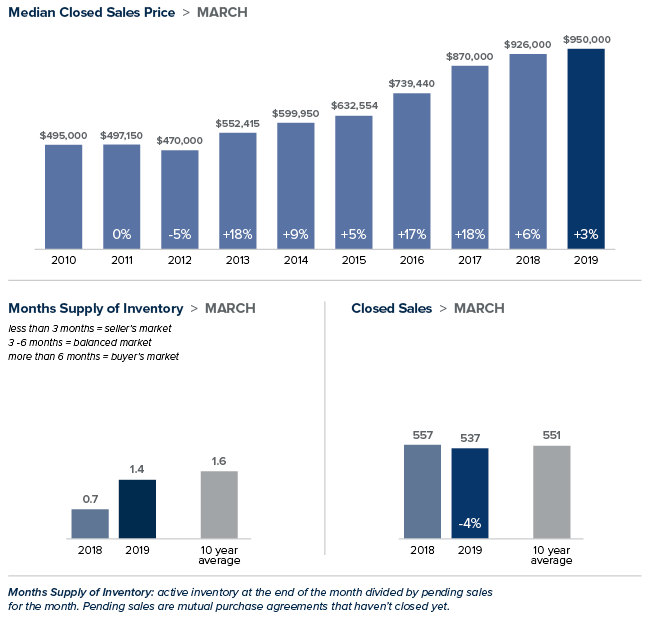
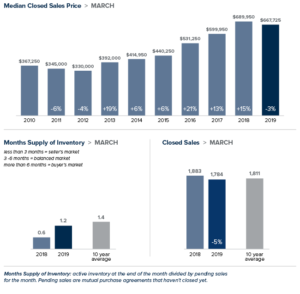
Unlike most of King County, home prices on the Eastside grew over the prior year. The median price of a single-family home on the Eastside rose 3% to $950,000. That represents an increase of $50,000 over February. Amazon’s plans to relocate its worldwide operations team to Bellevue is expected to add thousands of employees to their Eastside campus and put even more demand on what is already tight inventory.
King County
>>>Click image to view full report.
The median price of single-family home in King County in March was $667,725. That figure was down 3% from the same time last year, but up from the $655,000 median price in February. The two areas that showed price increases year-over-year were the most expensive area in the county – the Eastside – and the least expensive – Southeast King County. The number of homes for sale was more than double that of a year ago, but still far short of enough to meet demand.
Seattle
>>>Click image to view full report.
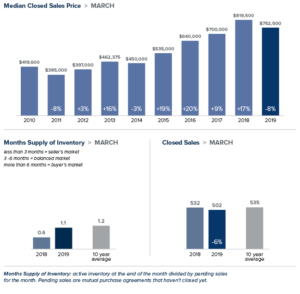
The median price of a single-family home in Seattle hit $752,500 in March, down 8% from a year ago, but up $22,500 from February. Inventory rose 136% over last year. Despite the increase, new listings that were competitively priced saw many multiple and contingency-stripped offers.
Snohomish County
>>>Click image to view full report.
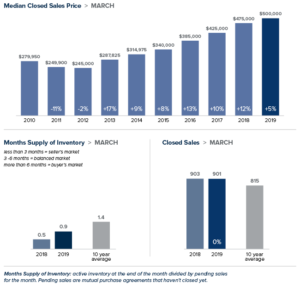
In Snohomish County, the median price of a single-family home grew 5.3% over last year to $500,000. That was an increase of $25,000 over February. A new passenger terminal at Paine Field is expected to provide a boost to the local economy and also lift demand for housing.
This post originally appeared on GetTheWReport.com.
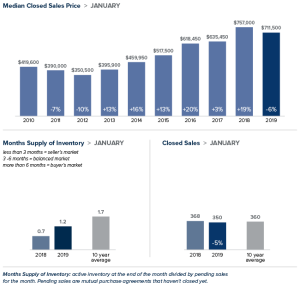
Local Market Update – February 2019
January brought more good news for homebuyers. Prices were down, inventory was up and interest rates hovered near a nine-month low. Those factors drove more buyers into the market and resulted in an uptick in sales for the month. We’ll see how this transitioning market evolves as we head into the prime Spring home buying season.
Eastside

>>>Click image to view full report.
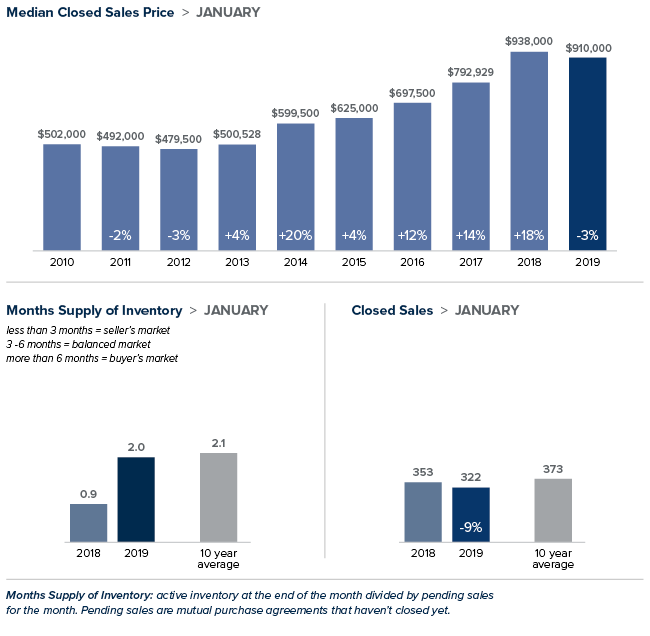
The most expensive region in King County saw prices soften in January. The median price of a single-family home on the Eastside dropped 3 percent over last January to $910,000. It’s an excellent time for buyers to leverage the cooling market and negotiate terms that work best for their needs. Last January, 39 percent of the homes in this area sold for over asking price. This January, that figure dropped to 12 percent. With its favorable business climate and high rankings for both economic growth and technology capabilities, demand on the Eastside is projected to remain strong.
King County

>>>Click image to view full report.
January marked the first time home prices in King County decreased year-over-year in seven years. The median price of a single-family home was $610,0000, a drop of 3 percent over the prior year. Inventory more than doubled. Unlike recent months, this was due primarily to more people putting their homes on the market, as opposed to homes taking longer to sell. Despite the surge in listings there is just two months of available inventory, far short of what is needed to meet demand.
Seattle
>>>Click image to view full report.
The median price of a single-family home in the city was $711,500 in January, a decrease of 6 percent year-over-year. Despite a 107 percent increase in homes for sale compared to a year ago, Seattle continues to have the tightest inventory in King County with less than two months of supply. A booming economy that shows no signs of slowing continues to draw more people to the city. The area will have to significantly add more inventory to meet that growing demand.
Snohomish County

>>>Click image to view full report.
The median price of a single-family home in January inched up 1 percent from last year to $455,000. That price is down from the median of $470,000 recorded in December. Snohomish County also saw a surge in inventory with the number of homes on the market double of what it was last year at this time.
This post originally appeared on the WindermereEastside.com Blog.
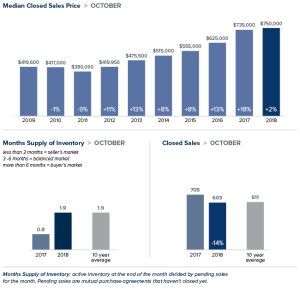
Local Market Update – November 2018
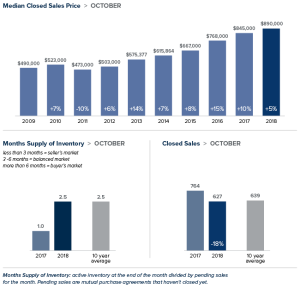
Increased inventory, slower sales and more price reductions all point to a balancing market—welcome news for price-shocked buyers. Sales prices are up from last October and down from the all-time high reached this spring. Despite the slowdown, it’s important to point out that we’re only moving back toward what a normal market looks like. King and Snohomish counties each have over two months of available inventory. While that is double the inventory of a year ago, it’s far short of the four to six months supply that is considered a balanced market. Sellers looking to list their home now can be sure there remains plenty of interest among home buyers.
Eastside

>>>Click image to view full report.
The median home on the Eastside sold for $890,000 in October, up 5 percent from a year ago and unchanged from the previous month. While year-over-year price increases were in the single digits for the Eastside overall, several areas, including Kirkland, Woodinville and Mercer Island, experienced double-digit price gains. Buyers are still having to pay a premium for desirable Eastside properties. However, with more choices and less buyer urgency, sellers need to price their home correctly to maximize their chances of getting the best possible return.
King County

>>>Click image to view full report.
Inventory in King County for all homes, both single-family and condominium, soared 102 percent over last October. The increase was due to an influx of new listings and the fact that homes are now taking longer to sell than at the peak of the market this spring. While buyers now have more breathing room to make their decisions, the 2.4 months of inventory in King County is still far from a balanced market. The median price of a single-family home in October was $670,999, an increase of 7 percent from the same time last year, and virtually unchanged from August and September. South King County showed larger increases, with prices rising more than 10 percent from a year ago in Auburn, Kent and Renton.
Seattle
>>>Click image to view full report.
In October, the median price of a single-family home in Seattle was $750,000, up 2 percent from last October and down slightly from last month. While inventory doubled over a year ago, Seattle falls behind most areas of King County in supply with just under two months of inventory available. Demand is predicted to stay high, with Seattle’s population projected to grow at twice the national rate next year. That said, buyers are in the position to be able to negotiate. A recent analysis named Seattle as one of the top markets in the country where it makes the most sense to buy this winter.
Snohomish County

>>>Click image to view full report.
Inventory in Snohomish County soared 65 percent in October as compared to a year ago. The area now has 2.4 months of inventory, about the same relative supply as King County. As with most of the Puget Sound area, the increase in inventory was due to a higher number of sellers listing their homes and fewer sales. Year-over-year, the median price of a single-family home sold in October in Snohomish County grew 8 percent to $473,000. The median price in September was $485,000.
This post originally appeared on the Windermere Eastside Blog.
The Gardner Report – Third Quarter 2018


The following analysis of the Western Washington real estate market is provided by Windermere Real Estate Chief Economist Matthew Gardner. We hope that this information may assist you with making better-informed real estate decisions. For further information about the housing market in your area, please don’t hesitate to contact your Windermere Agent.
Economic Overview
Washington State continues to be one of the fastest growing states in the nation and there is little to suggest that there will be any marked slowdown in the foreseeable future. Over the past year, the state has added 105,900 new jobs, representing an annual growth rate of 3.2%. This remains well above the national rate of 1.65%. Private sector employment gains continue to be robust, increasing at an annual rate of 3.7%. The strongest growth sectors were Construction (+7.4%), Information (+6.2%), and Professional & Business Services (+6.1%). The state’s unemployment rate was 4.5%, down from 4.8% a year ago.
All year I’ve been predicting that Washington State’s annual job growth would outperform the nation as a whole, and we now know with certainty that this is going to be the case. Furthermore, I am now able to predict that statewide job growth in 2019 will be equally strong, with an expected increase of 2.6%.
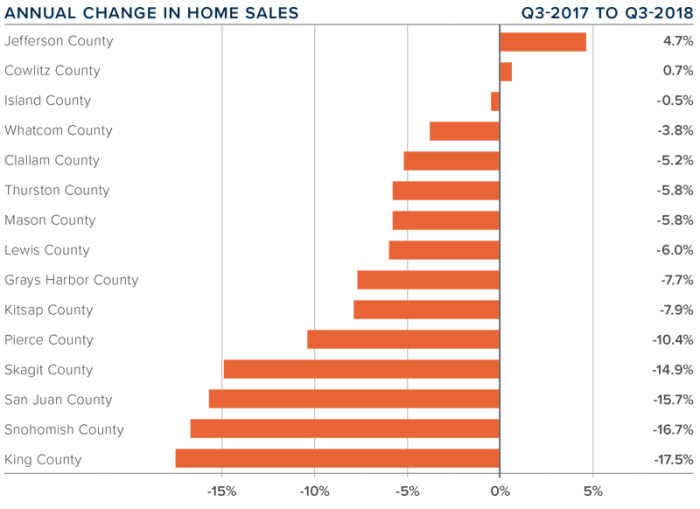
Home Sales Activity
-
There were 22,310 home sales during the third quarter of 2018. This is a significant drop of 12.7% compared to the third quarter of 2017.
-
The number of homes for sale last quarter was up 14.5% compared to the third quarter of 2017, continuing a trend that started earlier in the year. However, the increase in listings was only in Seattle’s tri-county area (King, Pierce, and Snohomish Counties) while listing activity was down across the balance of the region.
-
Only two counties had a year-over-year increase in home sales, while the rest of Western Washington saw sales decrease.
-
The region has reached an inflection point. With the increase in the number of homes for sale, buyers now have more choices and time to make a decision about what home to buy.
Home Prices

-
As inventory levels start to rise, some of the heat has been taken off the market, which caused home prices in the Western Washington region to go up by a relatively modest 6.2% over last year to $503,039. Notably, prices are down by 4.4% when compared to the second quarter of this year.
-
Home prices, although higher than a year ago, continue to slow due to the significant increase in the number of homes for sale. This, in my opinion, is a very good thing.
-
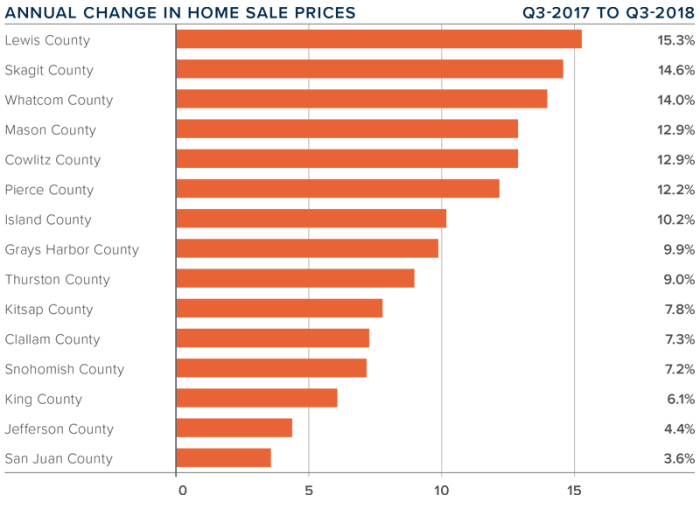
When compared to the same period a year ago, price growth was strongest in Lewis County, where home prices were up 15.3%. Six other counties experienced double-digit price increases.
-
Slowing price growth was inevitable; we simply could not sustain the increases we’ve experienced in recent years. Lower rates of appreciation will continue until wage growth catches up.
Days on Market
-
The average number of days it took to sell a home dropped by four days compared to the same quarter of 2017.
- Across the entire region, it took an average of 39 days to sell a home in the third quarter of this year. This is down from 43 days in the third quarter of 2017 and down 2 days when compared to the second quarter of 2018.
-
King County continues to be the tightest market in Western Washington, with homes taking an average of only 19 days to sell. Every county in the region other than Skagit and King — which both saw the time on the market rise by 2 days — saw the length of time it took to sell a home drop when compared to the same period a year ago.
-
More choice in the market would normally suggest that the length of time it takes to sell a home should rise, but the data has yet to show that. That said, compared to last quarter, we are seeing some marked increases in days on market in several counties, which will be reflected in future reports.

Conclusions

This speedometer reflects the state of the region’s real estate market using housing inventory, price gains, home sales, interest rates, and larger economic factors. I started to move the needle toward buyers last quarter and have moved it even further this quarter. Price growth continues to slow, but more significant is the rise in listings, which I expect to continue as we move toward the quieter winter period.
I believe that psychology will start to play a part in the housing market going forward. It has been more than 15 years since we’ve experienced a “balanced” market, so many home buyers and sellers have a hard time remembering what one looks like. Concerns over price drops are overrated and the length of time it’s taking to sell a home is simply trending back to where it used to be in the early 2000s.

Matthew Gardner is the Chief Economist for Windermere Real Estate, specializing in residential market analysis, commercial/industrial market analysis, financial analysis, and land use and regional economics. He is the former Principal of Gardner Economics, and has more than 30 years of professional experience both in the U.S. and U.K.
This post originally appeared on the Windermere.com Blog.
What’s Really Happening in the Housing Market?

Our housing market is finally cooling a bit, from scorching hot to slightly-less-sweltering. While some alarmists are talking bubble or impending crisis, the statistics tell a different story. The market does appear to be shifting, and that’s good news! The steep price increases of the past few years are not sustainable, and also risk pricing buyers out of the market altogether.
Where The Market Is Today
- Inventory is up, but still far short of demand. Despite a considerable increase in inventory, King County has just six weeks of supply. Four to six months of inventory is what is considered a balanced market, and we’re far short of that.
- Homes are staying on the market a bit longer. New listings have increased in the past few months, but the increase in inventory is primarily due to homes staying on the market longer. With buyers accustomed to homes being snapped up in days, “longer” is a relative term. Homes in King County are taking an average of 15 days to sell.
- Prices appear to be moderating. While home prices are up compared to a year ago, the rate of increase is in the single digits rather than the double-digit surges of past months. Prices are down 4 percent from the record high reached this spring.
What This Means For The Housing Market
- The shift towards slower, consistent appreciation will result in a healthier market.
- Buyers have more choices and more time to make an informed decision.
- It’s still a seller’s market, but sellers need to have realistic expectations about pricing their homes as the market softens.
- More inventory is still needed to meet demand.
Whether you’re thinking about buying or selling, it’s important to have the most current information about the market. Our Windermere brokers can provide you with statistics about today’s market and answer any questions you may have.
This post originally appeared on the Windermere Eastside Blog.

